


Stocks Consolidate in advance of Continuation of Short-term Rally
Stock-Markets / US Stock Markets Mar 22, 2009 - 05:58 AM GMTBy: Mike_Burk
 The good news is: After 2 consecutive down days there has been no build up of new lows.
Short Term
Between the low of March 9 and the high of last Wednesday:
The Russell 2000 (R2K) was up 21.7% in 7 days.
The NASDAQ composite (OTC) was up 17.5% in 7 days.
The S&P 500 (SPX) was up 17.4% in 7 days.
The Dow Jones Industrial Average (DJIA) was up 14.4% in 7 days.
These advances are similar to those that occurred after the October 9, 1008 low, the October 27, 2008 low and the November 20, 2008 low.
Following the October 9, 2008 low, NYSE new lows fell from 2901 to 48 in 2 days then back over 500 while NASDAQ new lows fell from 1514 to 81 then back up to 374.
Following the October 27, 2008 low, NYSE new lows fell from 1125 to 21 in 6 days then back up to 133 while NASDAQ new lows fell from 788 to 47 then back up to 163.
Following the November 20 low, NYSE new lows fell from 1894 to 21 then back up to 98 while NASDAQ new lows fell from 1158 to 29 then back up to 114.
Although there were fewer new lows on March 9 than any of the 3 recent lows, there were enough to imply a retest. If the retest occurs without a build up in new lows it would mark the beginning of an intermediate term rally.
Intermediate term
Any rally that is going to last for more than a few weeks will have to have both a limited number of new lows (less than 50) and an expanding number of new highs.
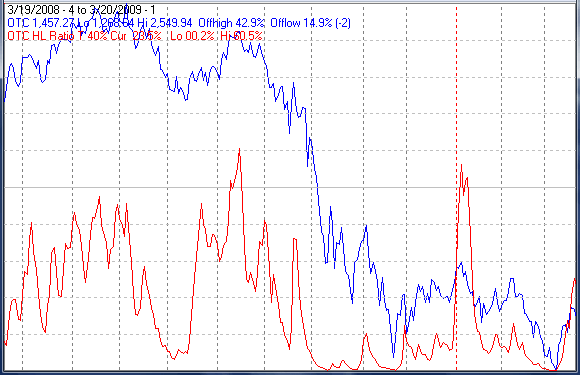
The chart below covers the past year showing the OTC in blue and a 40% trend (4 day EMA) of the ratio of NASDAQ new highs to new highs + new lows (NH / NH + NL) in red. Dashed vertical lines have been drawn on the 1st trading day of each month. Dashed horizontal lines have been drawn at 10% levels for the indicator; the line is solid at the 50% level, the neutral point.
The indicator has a way to go before giving an all clear signal, but, at least it is headed in the right direction.
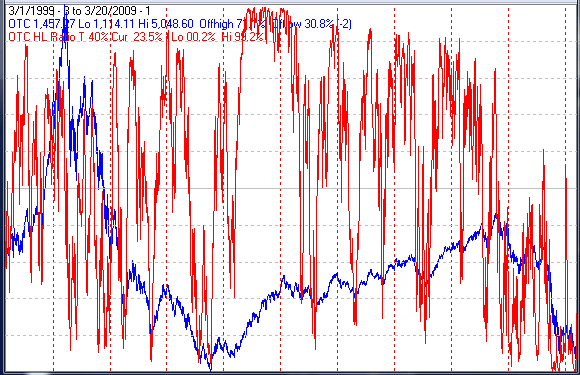
The chart below is similar to the one above except it covers the past 10 years to give you a longer term perspective on how this indicator has worked. Dashed vertical lines have been drawn on the 1st trading day of each year.
It has been over a year since the indicator spent more than a few days above the 50% level.
Seasonality
Next week includes the week prior to the 4th Friday of March during the 1st year of the Presidential Cycle.
The tables show the daily return on a percentage basis for the week prior to the 4th Friday of March during the 1st year of the Presidential Cycle. OTC data covers the period from 1963 - 2008 and SPX data from 1953 - 2008. There are summaries for both the 1st year of the Presidential Cycle and all years combined. Prior to 1953 the market traded 6 days a week so that data has been ignored.
For the coming week returns, by all measures, have been modestly negative.
Report for the week before the 4th Friday of March
The number following the year is the position in the presidential cycle.
Daily returns from Monday through the 4th Friday.
| OTC Presidential Year 1 | ||||||
| Year | Mon | Tue | Wed | Thur | Fri | Totals |
| 1965-1 | 0.02% | -0.25% | -0.10% | 0.08% | -0.14% | -0.39% |
| 1969-1 | 0.06% | -0.10% | -0.29% | 0.15% | 0.34% | 0.16% |
| 1973-1 | -1.06% | -0.57% | -1.17% | -1.85% | -0.19% | -4.83% |
| 1977-1 | -0.19% | -0.22% | -0.30% | -0.23% | -0.27% | -1.21% |
| 1981-1 | 0.64% | 0.04% | 0.78% | 0.11% | -0.34% | 1.22% |
| 1985-1 | -0.30% | 0.62% | -0.03% | 0.09% | -0.04% | 0.34% |
| Avg | -0.17% | -0.05% | -0.20% | -0.35% | -0.10% | -0.86% |
| 1989-1 | -0.09% | 0.51% | 0.27% | 0.21% | 0.54% | 1.44% |
| 1993-1 | -0.89% | -0.23% | -0.10% | 0.99% | 0.08% | -0.16% |
| 1997-1 | 0.00% | 0.00% | 0.00% | 0.00% | 0.00% | 0.00% |
| 2001-1 | 3.19% | -4.81% | -1.46% | 3.69% | 1.63% | 2.24% |
| 2005-1 | 0.00% | 0.00% | 0.00% | 0.00% | 0.00% | 0.00% |
| Avg | 0.73% | -1.51% | -0.43% | 1.63% | 0.75% | 1.17% |
| OTC summary for Presidential Year 1 1965 - 2005 | ||||||
| Avg | 0.15% | -0.56% | -0.27% | 0.36% | 0.18% | -0.13% |
| Win% | 44% | 33% | 22% | 78% | 44% | 56% |
| OTC summary for all years 1963 - 2008 | ||||||
| Avg | -0.21% | -0.17% | 0.15% | 0.12% | 0.08% | -0.03% |
| Win% | 49% | 44% | 51% | 59% | 51% | 56% |
| SPX Presidential Year 1 | ||||||
| Year | Mon | Tue | Wed | Thur | Fri | Totals |
| 1953-1 | -0.61% | 0.58% | -0.27% | -0.57% | 0.15% | -0.72% |
| 1957-1 | -0.45% | 0.43% | 0.14% | 0.02% | -0.11% | 0.02% |
| 1961-1 | 0.40% | -0.19% | -0.06% | -0.26% | -0.17% | -0.28% |
| 1965-1 | -0.01% | 0.12% | 0.18% | -0.29% | -0.74% | -0.74% |
| 1969-1 | -0.13% | 0.16% | 0.73% | 0.71% | 0.41% | 1.88% |
| 1973-1 | -1.21% | -0.20% | -1.30% | -1.49% | 0.04% | -4.16% |
| 1977-1 | -0.54% | -0.31% | -0.79% | -0.50% | -0.64% | -2.78% |
| 1981-1 | 1.20% | -0.75% | 1.81% | -0.61% | -1.19% | 0.46% |
| 1985-1 | 0.20% | 1.50% | -0.26% | 0.15% | -0.17% | 1.42% |
| Avg | -0.10% | 0.08% | 0.04% | -0.35% | -0.31% | -0.64% |
| 1989-1 | 0.55% | 0.35% | 0.26% | 0.06% | 0.80% | 2.02% |
| 1993-1 | -0.29% | -0.03% | -0.15% | 0.63% | -0.69% | -0.53% |
| 1997-1 | 0.00% | 0.00% | 0.00% | 0.00% | 0.00% | 0.00% |
| 2001-1 | 1.76% | -2.41% | -1.79% | -0.41% | 1.99% | -0.85% |
| 2005-1 | 0.00% | 0.00% | 0.00% | 0.00% | 0.00% | 0.00% |
| Avg | 0.67% | -0.69% | -0.56% | 0.09% | 0.70% | 0.21% |
| SPX summary for Presidential Year 1 1953 - 2005 | ||||||
| Avg | 0.07% | -0.06% | -0.13% | -0.21% | -0.03% | -0.35% |
| Win% | 42% | 50% | 42% | 42% | 42% | 42% |
| SPX summary for all years 1953 - 2008 | ||||||
| Avg | -0.10% | -0.01% | 0.00% | -0.05% | -0.08% | -0.23% |
| Win% | 40% | 48% | 44% | 42% | 50% | 38% |
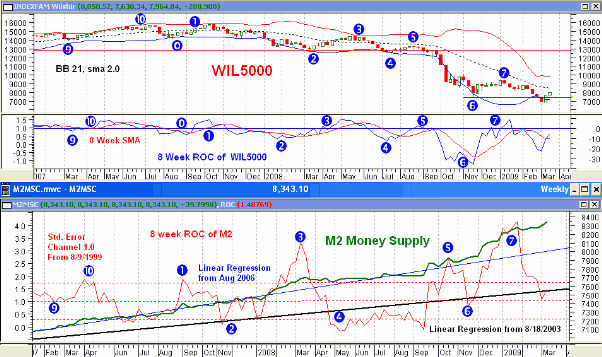
Money supply (M2)
The money supply chart was provided by Gordon Harms. Money supply growth has stalled.
Conclusion
The market should retest the March lows, but, that may take a few weeks. Much of the overbought condition was relieved Thursday and Friday.
I expect the major indices to be higher on Friday March 27 than they were on Friday March 20.
Last weeks negative forecast was a miss.
Thank you,
By Mike Burk
To subscribe to this report : http://alphaim.net/signup.html
Gordon Harms produces a Power Point for our local timing group. You can get a copy of that at: http://www.stockmarket-ta.com/ .
Disclaimer: Mike Burk is an employee and principal of Alpha Investment Management (Alpha) a registered investment advisor. Charts and figures presented herein are believed to be reliable but we cannot attest to their accuracy. Recent (last 10-15 yrs.) data has been supplied by CSI (csidata.com), FastTrack (fasttrack.net), Quotes Plus (qp2.com) and the Wall Street Journal (wsj.com). Historical data is from Barron's and ISI price books. The views expressed are provided for information purposes only and should not be construed in any way as investment advice. Furthermore, the opinions expressed may change without notice.
Mike Burk Archive |
© 2005-2022 http://www.MarketOracle.co.uk - The Market Oracle is a FREE Daily Financial Markets Analysis & Forecasting online publication.