


What are the Institutional Stock Market Investors Doing?
Stock-Markets / US Stock Markets Mar 13, 2009 - 12:42 PM GMTBy: Marty_Chenard

 You will lose money if you go against the action of what Institutional Investors are doing.
Many of you subscribe to Investors Business Daily and pay particular attention to the "Accumulation/Distribution ratings" they show on listed stocks.
Their readers have learned that a stock in "Distribution" is being sold off or dumped, and that it is not a safe buy until "Accumulation" starts.
It is all the more important to apply this concept to the stock market as a whole, because if the stock market is in Distribution, then the majority of individual stocks will also be in Distribution and moving lower.
That is why we report on the stock market Accumulation/Distribution every day.
We do this by following the action of what Institutional Investors are doing. Since Institutional Investors are responsible for OVER half of the daily trading volume, they turn out to be the deciding force and direction of the overall market.
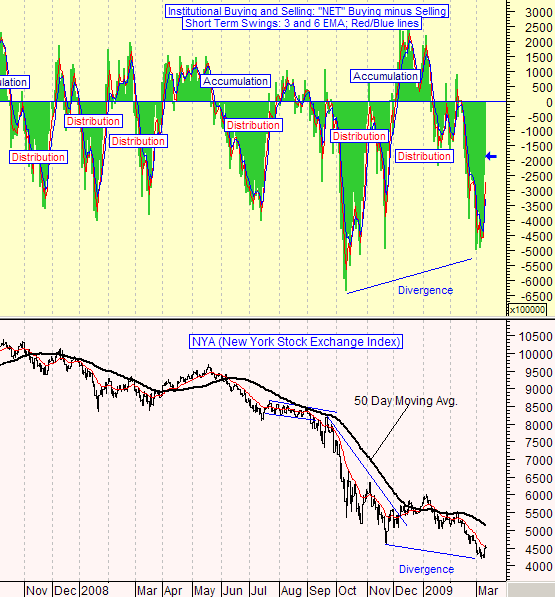
So, this morning, we will share our Institutional Accumulation/Distribution chart. To get that net result, we take all the Institutional buying on a given day, and subtract the Institutional selling. That gives us the net difference which is by definition, accumulation or distribution.
Below is the Net Accumulation/Distribution chart going back to October of 2007. It is easy to read ... if the green bars are above zero, then Institutions were in Accumulation. If the green bars are below zero, then Institutional Investors were in Distribution.
With that understanding, take a minute to look at the Accumulation/Distribution chart, and compare it to the movement on the NYA (New York Stock Exchange Index) chart below it. After observing the chart, it should be pretty clear that the market does NOT go in a different direction of the Institutional Accumulation or Distribution.
So, the message is clear ... invest in the SAME direction as the Institutions, and never go against them.
If you are buying when they are selling, you will lose because they are the top dog and top force in the stock market.
(This chart is shown as a courtesy today, and in fairness to our paid subscribers, it will not be shown again until some time in April. Additional commentary about this chart can be found on Section 4, Chart 7 of our Standard Subscriber site.)
________________________________________________
*** Feel free to share this page with others by using the "Send this Page to a Friend" link below.
By Marty Chenard
http://www.stocktiming.com/
Please Note: We do not issue Buy or Sell timing recommendations on these Free daily update pages . I hope you understand, that in fairness, our Buy/Sell recommendations and advanced market Models are only available to our paid subscribers on a password required basis. Membership information
Marty Chenard is the Author and Teacher of two Seminar Courses on "Advanced Technical Analysis Investing", Mr. Chenard has been investing for over 30 years. In 2001 when the NASDAQ dropped 24.5%, his personal investment performance for the year was a gain of 57.428%. He is an Advanced Stock Market Technical Analyst that has developed his own proprietary analytical tools. As a result, he was out of the market two weeks before the 1987 Crash in the most recent Bear Market he faxed his Members in March 2000 telling them all to SELL. He is an advanced technical analyst and not an investment advisor, nor a securities broker.
Marty Chenard Archive |
© 2005-2022 http://www.MarketOracle.co.uk - The Market Oracle is a FREE Daily Financial Markets Analysis & Forecasting online publication.