The Great Depression Facts: Double Dip Economic Slump
Economics / Economic Depression Feb 09, 2009 - 05:16 PM GMTBy: Paul_L_Kasriel

 Contrary to what you might believe, the Great Depression of the 1930s was not a decade-long era of economic decline. Rather, the Great Depression was made up of two distinct economic slumps - August 1929 through March 1933 and May 1937 through June 1938. As Chart 1 shows, the first recessionary period of the Great Depression was not only longer in duration, but more severe in magnitude. Notice, however, that a quite robust economic recovery/expansion occurred between the two recessions.
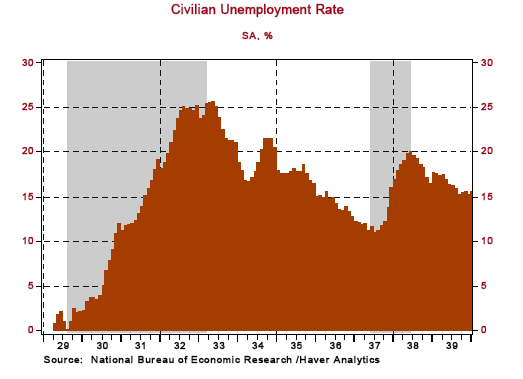
In the four years ended 1937, real GDP grew at a compound annual rate of 9.4% . Lest you think that all of the increase in real GDP growth in the four years ended 1937 was accounted for by federal government spending, Chart 2 should dissuade you of this notion. In the four years ended 1937, real GDP excluding real federal government expenditures grew at a compound annual rate of growth of 9.0% . In the four years ended 1937, industrial production grew at a compound annual rate of 12.9% (see Chart 3). Although this vigorous real economic recovery did not bring the unemployment rate back down to anywhere near where it was before the 1929 recession commenced, the unemployment rate did fall from a cycle high of 25.6% in May 1933 to a cycle low of 11.0% in July 1937 (see Chart 4).
Chart 1
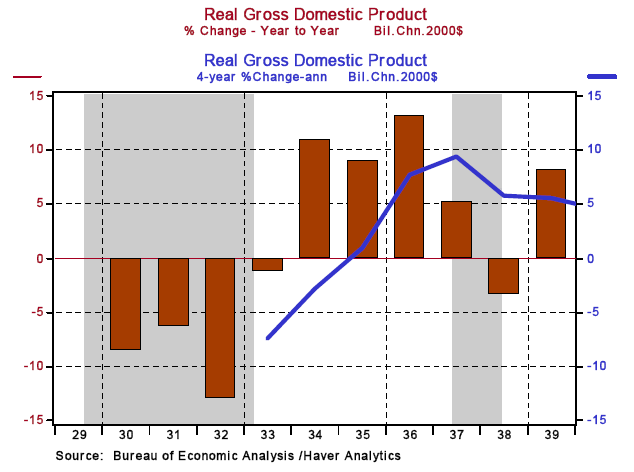
Chart 2
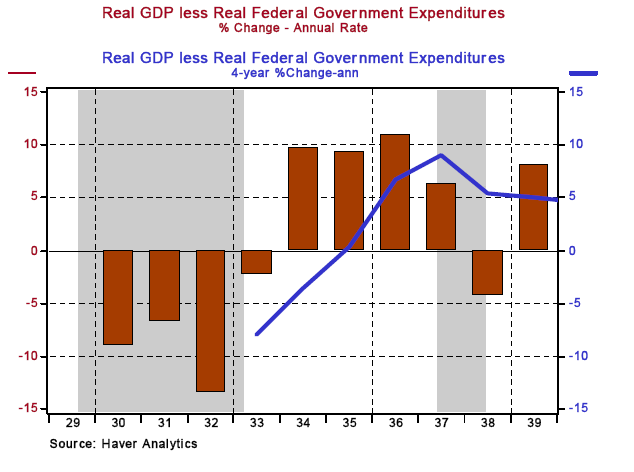
Chart 3
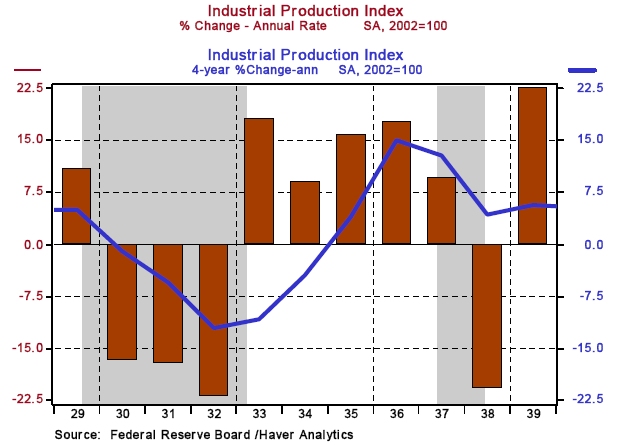
Chart 4
Given some of the economic policy decisions made in 1930, 1931 and 1932, it is quite remarkable that a recovery commenced in April 1933. To wit, in 1930, Congress passed the Smoot-Hawley tariff legislation, effectively a large tax increase on imported goods. In response to this, a number of other foreign governments retaliated by passing their own tariff legislation. As a result, global trade collapsed.
After the stock market crashed in October 1929, the New York Fed cut its discount rate by 100 basis points to a level of 5% on November 1. The New York Fed continued reducing its discount rate through May 8, 1931, when the level came to rest at 1-1/2%. Then in two 100 basis point steps - on October 9, 1931 and on October 16, 1931 - the New York Fed increased its discount rate. So, the discount rate went from 1-1/2% on October 8, 1931 to 3-1/2% on October 16, 1931 - a two percentage point increase in approximately a one-week time span. On February 26, 1932, the discount rate was reduced to 3% and then reduced to 2-1/2% on June 24, 1932.
In 1932, marginal income tax rates on personal income were raised. In 1931, the highest marginal tax rate was 25% on incomes in excess of $100,000. In 1932, the marginal tax rate on incomes between $100,000 and $150,000 was increased to 56% - more than a 100% increase in this marginal tax rate . What's more, the top marginal tax rate went to 63% on incomes in excess of $1,000,000. So, if you were a million-dollar earner in 1931 and 1932, your marginal income tax rate increased by over 150%.
Starting in 1930 and continuing through 1933, almost 9,100 commercial banks failed with deposits of $6.8 billion . The deposits of these failed banks represented 13.3% of total commercial bank deposits as of 1929. Net losses to depositors of these failed banks were about $1.3 billion, or approximately 19% of the deposits of failed commercial banks. Between December 31, 1929 and December 31, 1933, commercial bank deposits, net of interbank deposits, contracted by 37% .
Despite protective tariffs, Fed discount rate increases, personal income tax rate increases and massive bank failures, the first recession of the Great Depression ended in March 1933, the same month in which Franklin D. Roosevelt was inaugurated as president. That is, the business cycle trough occurred before the "New Deal" policies were implemented.
In 1936, marginal personal income tax rates were increased again. For incomes between $100,000 and 150,000, the tax rate went from 56% to 62%, a 10.7% increase in the tax rate; for incomes between $1,000,000 and $2,000,000, the tax rate went from 63% to 77%, a 22.2% increase ; and for incomes in excess of $5,000,000, the marginal tax rate became 79%, an increase of 25.4% from the previous top marginal tax rate of 63%. Between August 1936 and May 1937, the Federal Reserve doubled the percentage of reserves commercial banks were required to hold relative to their deposits. The economic expansion that commenced in April 1933 then peaked in May 1937. The economy entered the second recession of the Great Depression, which lasted through June 1938.
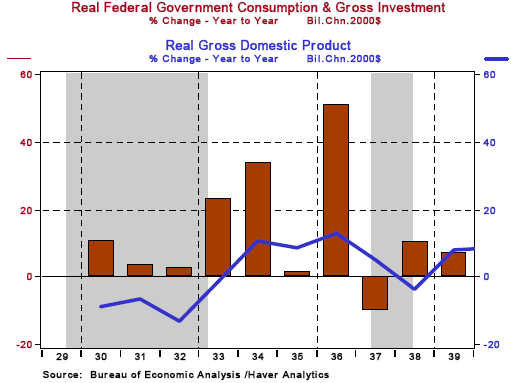
There is much discussion in the media of late that FDR's "New Deal" policies were detrimental to economic growth during the 1930s. But we need to make a distinction between New Deal policies that dealt with increased federal government spending and those that dealt with the direct interference in markets. Perhaps the New Deal policies that directly interfered with markets were responsible for keeping the unemployment rate from falling as much as it otherwise would have. But as was discussed at the outset of this commentary, real GDP grew at a compound annual rate of growth of 9.4% in the four years ended 1937. Chart 5 shows the behavior of the percentage change in annual average real GDP and the percentage change in annual average real federal government expenditures. Perhaps it is coincidental that real GDP contracted by significantly less in 1933 and grew in 1934 through 1937 as the rate of growth in real federal government expenditures increased significantly in 1933, 1934 and 1936. Perhaps, had it not been for the stepped up increases in real federal government expenditures, the compound annual rate of growth in real GDP in the four years ended 1937 would have been even higher than 9.4%. Perhaps.
Chart 5
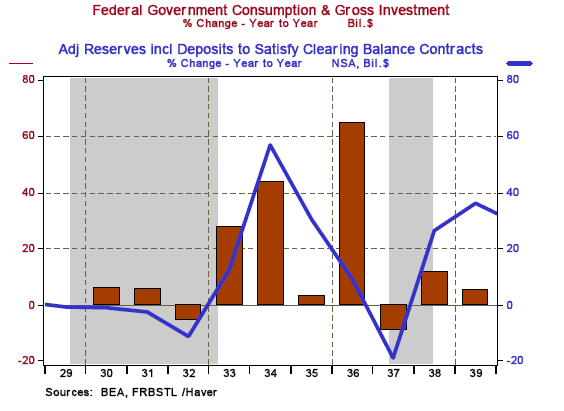
I have argued that increased government spending without the monetization of the increased federal debt has little impact on aggregate demand - real or nominal. That is, if increased federal government spending is funded by increased taxes or increased sales of Treasury securities to the nonbank public that are not monetized by the Fed and the banking system, then spending "power" is merely transferred from the private sector to the government sector, the net result of which is little if any increase in total spending in the economy. In this regard, it is interesting to observe the behavior of commercial bank reserves, which are, in effect, credit created by the Fed figuratively "out of thin air," during the 1930s. This is shown in Chart 6. The change in bank reserves was negative from 1929 through 1932. Then rapid growth in reserves commenced in 1933. In the four years ended 1936, bank reserves grew at a compound annual rate of 25.9%. Then, in 1937, reserves contracted by 18.9% along with a contraction in nominal federal government expenditures.
Chart 6
What does this review of historical facts have to do with the current economic environment? For starters, the policy hurdles that were put in front of an economic recovery in the early 1930s are absent today. The "Buy American" proposal related to the fiscal stimulus program seems to have gone by the wayside. The Fed has no intention of raising interest rates until it is sure the economy has begun to recover. Personal income tax rates are not likely to be raised until 2011. If the top marginal rate is increased then, the increase will be considerably smaller in absolute and relative terms than the tax increases of 1932 or 1936. Today, we have federal deposit insurance, so, for the most part, bank and thrift depositors will not incur losses if institutions fail. In addition, we have income maintenance programs such as Social Security, Medicare, Medicaid, food stamps and unemployment insurance. So, the hurdles that today's economy has to jump over to enter a recovery would appear to be much lower than the hurdles that were erected between 1930 and 1932.
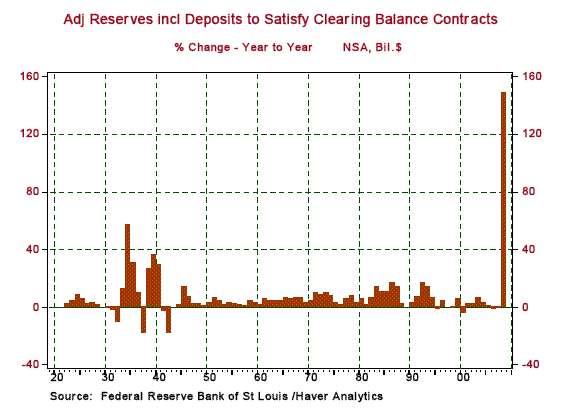
In addition, the federal government is about to embark on a massive fiscal stimulus program. Will the Fed monetize much of the new debt issued to fund this program? We do not know yet. But if recent history is any guide, the answer is yes. Chart 7 shows that the growth in bank reserves in 2008 was almost 149% - an unprecedented increase. If the federal government embarks on a large spending spree and the Fed "prints" the money to fund the spending, then the pace of real economic activity is bound to increase. How long it will take for higher prices to begin to erode real activity is another question. But never underestimate the initial positive impact on aggregate demand of that powerful combination of increased federal government spending/tax cuts and a central bank running the monetary printing press at a high speed.
Chart 7
It is not my role to endorse government policies. It is my role to forecast the impact of government policies on the economy. I believe that large increases in federal government spending that are monetized by the Fed and the banking system will result in a recovery in real economic activity. When that recovery sets in depends on how quickly the federal government increases its spending and by the magnitude of that increase. We can debate whether tax rates should be cut or federal spending should be increased. We can debate what kinds of spending should be increased. We can debate whether the federal government should increase any of its spending. But the facts of the 1930s appear to be pretty clear - monetized increased federal government spending does result in increased real economic activity in the short run.
The economic data are likely to be abysmal through the first half of this year. The popular media will reinforce the gloom of the data. The same pundits who did not see this downturn coming will not see the recovery coming either. My advice to you is to keep your eye on the index of Leading Economic Indicators. If history is any guide, the LEI will signal a recovery well ahead of the pundits.
Paul Kasriel is the recipient of the 2006 Lawrence R. Klein Award for Blue Chip Forecasting Accuracy
By Paul L. Kasriel
The Northern Trust Company
Economic Research Department - Daily Global Commentary
Copyright © 2009 Paul Kasriel
Paul joined the economic research unit of The Northern Trust Company in 1986 as Vice President and Economist, being named Senior Vice President and Director of Economic Research in 2000. His economic and interest rate forecasts are used both internally and by clients. The accuracy of the Economic Research Department's forecasts has consistently been highly-ranked in the Blue Chip survey of about 50 forecasters over the years. To that point, Paul received the prestigious 2006 Lawrence R. Klein Award for having the most accurate economic forecast among the Blue Chip survey participants for the years 2002 through 2005.
The opinions expressed herein are those of the author and do not necessarily represent the views of The Northern Trust Company. The Northern Trust Company does not warrant the accuracy or completeness of information contained herein, such information is subject to change and is not intended to influence your investment decisions.
Paul L. Kasriel Archive |
© 2005-2022 http://www.MarketOracle.co.uk - The Market Oracle is a FREE Daily Financial Markets Analysis & Forecasting online publication.


