Underlying Stock Market Trend Conditions
Stock-Markets / US Stock Markets Jan 29, 2009 - 04:21 AM GMTBy: Marty_Chenard
 You are looking at the highway and see a car moving swiftly, efficiently, and smoothly down the road. You think in my youngest son's vernacular and say, "Wow, that's a sweet car".
After going two hundred feet down the road, the car backfires, sputters, and stops.
He couldn't see what was really important ... what was going on under the hood.
Monitoring what is going on "under the hood" gives you the feedback you need to assess the safety and condition of a car. The stock market is the same way ... it needs monitoring of "underlying fundamental conditions" in order to assess its condition.
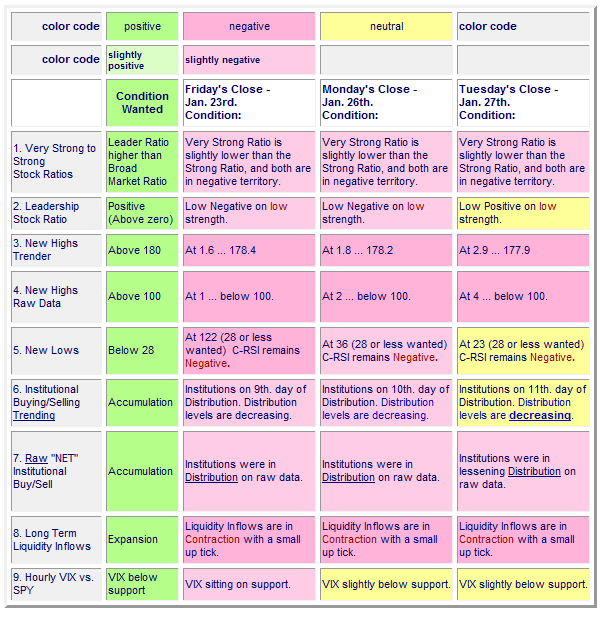
Below is a sample of our "Daily assessment of Underlying stock market conditions."
It is a simple, color coded matrix, showing the change of 9 important "under the hood" conditions about the stock market. Strong and safe market rallies have "Green" conditions. Red conditions are Negative, and Yellow conditions are Neutral.
Every day we post and email this chart along with our market commentary to paid subscribers. It shows the conditions over the past 3 days so that an investor can quickly see the current "change in conditions" with one quick glance ... just by observing the change in colors.
Here are the Underlying Market Conditions as of the close yesterday: We had 3 negative readings, 2 lesser negative readings, 4 Neutral readings, 0 Positive readings, and 0 Lesser Positive readings.
Conclusion: Underlying conditions showed improvement yesterday. Improvement, but no signs of emerging "Green conditions" yet. For day traders, that tells them that the intra-day bias is moving toward the upside, so intra-day shorting is out. For longer term investors, it says that overall market-supportive conditions remain weak and with no emerging green conditions to support a prudent case for any sustainable upside rally.
Today's chart is provided as a courtesy "look and see" for our free members. This is the first time that we have posted this chart on the free site and it won't be reposted here until May or June.

________________________________________________
*** Feel free to share this page with others by using the "Send this Page to a Friend" link below.
By Marty Chenard
http://www.stocktiming.com/
Please Note: We do not issue Buy or Sell timing recommendations on these Free daily update pages . I hope you understand, that in fairness, our Buy/Sell recommendations and advanced market Models are only available to our paid subscribers on a password required basis. Membership information
Marty Chenard is the Author and Teacher of two Seminar Courses on "Advanced Technical Analysis Investing", Mr. Chenard has been investing for over 30 years. In 2001 when the NASDAQ dropped 24.5%, his personal investment performance for the year was a gain of 57.428%. He is an Advanced Stock Market Technical Analyst that has developed his own proprietary analytical tools. As a result, he was out of the market two weeks before the 1987 Crash in the most recent Bear Market he faxed his Members in March 2000 telling them all to SELL. He is an advanced technical analyst and not an investment advisor, nor a securities broker.
Marty Chenard Archive |
© 2005-2022 http://www.MarketOracle.co.uk - The Market Oracle is a FREE Daily Financial Markets Analysis & Forecasting online publication.


