Insitutional Investors Stock Index Trading Range Breakout Imminent
Stock-Markets / US Stock Markets Jan 14, 2009 - 04:43 PM GMTBy: Marty_Chenard
 This Friday, it will be 6 full weeks that the Institutional Index has stayed within its trading range ... will it make it that long?
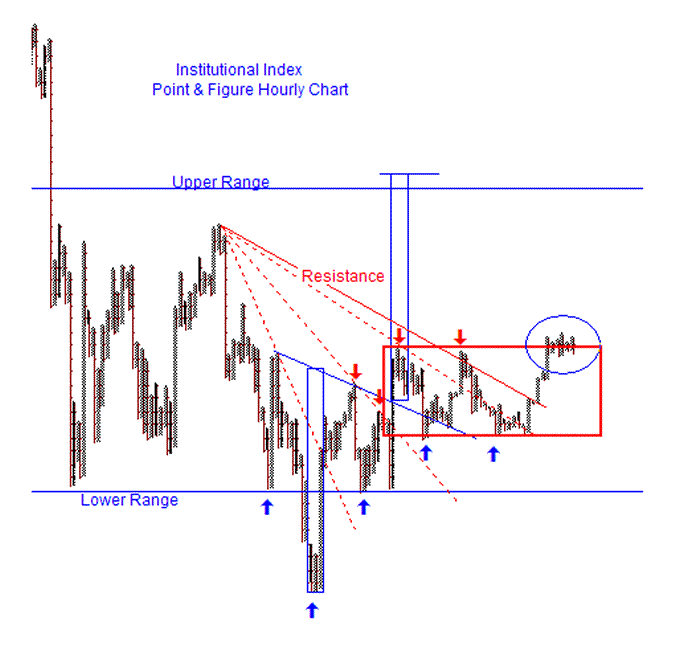
It was exactly one week ago when we showed you the 60 minute Point & Figure chart for the Institutional "core holdings" index. Last week's chart is posted first, followed by this week's chart.
As seen below (for last week), the Institutional Index was having a prolonged and difficult time testing the resistance of its upper trading range. At that time, it had a negative bias relative to the S&P 500's Point & Figure chart.
The negative Institutional bias won out the same day we posted it (last Wednesday), with the market moving down. See the next chart ...

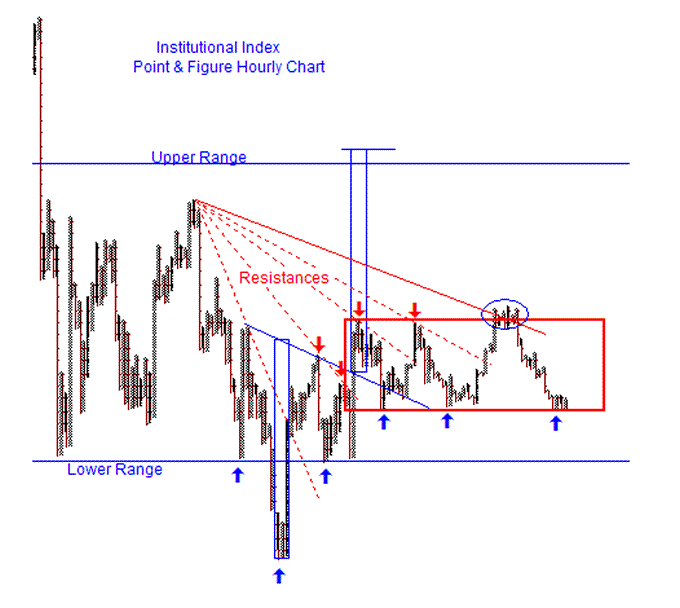
Here we are one week later ...
At the close yesterday, the Institutional Index was facing the OPPOSITE testing problem.
1. During the past week, the index failed at its upper range's resistance,
2. Dropped all the way down to the range's lower support, and ...
3. Now is doing the same hesitation dance it did last week. It has now spent two days trying to hold this important support level.
A 6 week trading range: Note the red boxed in area depicting the trading range. The Institutional Index has been in a trading range since December 5th. The trading range has had 3 upside resistance/tests , and is now going through its 3rd. support test . A lot is at stake now, because the longer the time period of a trading range, the more important and consequential is its breakout.
Today will be a spirited test for the Institutional Index. At the open it will likely drop below the trading range's support. What happens next , and the rest of the day is what will matter ... as well as how it finally closes at 4 PM.
A lot is at stake today ... if the Institutional index fails to the downside, then it will move lower and retest the previous lows . However, if it can hold the support and move up, Obama will have the positive prospect of enjoying his inaugural next week ... with the chance of an upside rally if he can make some quick and positive economic moves.

*** Feel free to share this page with others by using the "Send this Page to a Friend" link below.
By Marty Chenard
http://www.stocktiming.com/
Please Note: We do not issue Buy or Sell timing recommendations on these Free daily update pages . I hope you understand, that in fairness, our Buy/Sell recommendations and advanced market Models are only available to our paid subscribers on a password required basis. Membership information
Marty Chenard is the Author and Teacher of two Seminar Courses on "Advanced Technical Analysis Investing", Mr. Chenard has been investing for over 30 years. In 2001 when the NASDAQ dropped 24.5%, his personal investment performance for the year was a gain of 57.428%. He is an Advanced Stock Market Technical Analyst that has developed his own proprietary analytical tools. As a result, he was out of the market two weeks before the 1987 Crash in the most recent Bear Market he faxed his Members in March 2000 telling them all to SELL. He is an advanced technical analyst and not an investment advisor, nor a securities broker.
Marty Chenard Archive |
© 2005-2022 http://www.MarketOracle.co.uk - The Market Oracle is a FREE Daily Financial Markets Analysis & Forecasting online publication.


