


Rydex Asset Data: Stock Market Leveraged Bulls v. Leveraged Bears
Stock-Markets / US Stock Markets Jan 09, 2009 - 01:42 PM GMTBy: Guy_Lerner

 I have presented a lot of data recently suggesting an intermediate term top for equities, and the weakness in prices this past week seems to be consistent with that view. Just as investors begin to embrace the hope that better times are coming, it's "bam" back to reality. This is still a bear market - sell hope, buy fear.
I have been reluctant to present the Rydex asset data for two reasons. One and as stated above, I have already presented enough data as to why I thought the market would stall at this juncture. Two, I have less confidence in the Rydex data due to the changing nature of this data set. Nonetheless, a reader asked me about the data, so here we go.
The Rydex Mutual Fund company provides data on how much money is going into each of their funds, so in this sense, we can see where investors are putting their own hard earned cash. In general, investors and traders have found the Rydex asset data useful as a contrarian tool. If, for example, there is too much money going into their money market fund, it means that Rydex investors are fearful of further stock market losses. So this would be a time to get long. The other thing useful about the Rydex Mutual Funds is that it allows investors to bet with or against the market and if their conviction is strong enough, the Rydex investor or trader can use leverage.
So why have I lost confidence in the Rydex asset data? Honestly, I am beginning to wonder whether it is still useful as a contrarian tool. Typically, I would bet against the Rydex investor as from 2002 to the end of 2007 it represented the "dumb money". Starting in 2008, betting with the Rydex investor has been a better strategy.
Why might the Rydex asset data become the "smart money"? I suspect it has to do with the proliferation of leveraged exchange traded funds seen over the past year. Prior to these ETF products, Rydex was one of the only games in town that allowed the use of leverage, that allowed intraday trading of their funds, and allowed betting against rising prices in the market. These features made Rydex unique until the new leveraged ETF's came along.
To support this notion as to why the Rydex data might no longer be relevant is that the amount of money in their funds has decreased by about 30% in 2008 alone. Maybe the only money left at Rydex is the "smart money". Of course, only time will tell if this notion of mine is correct. Data like the Rydex asset data have a tendency to change as the times change. What was once considered extreme is no longer. Investors and markets change. Money finds another home.
As per the reader request, I present the amount of leveraged assets in the Rydex bull oriented funds versus the amount of leveraged assets in the bear oriented funds. Despite my concerns above, this is one of my favorite Rydex indicators. Not only can we see how these market timers are betting on market direction, but we can also see if they are doing so with conviction (i.e., leverage). Figure 1 is a weekly chart of the Power Shares QQQ Trust (symbol: QQQQ). The middle panel is the actual data of the Rydex leveraged bulls (green) v. leveraged bears (red). The indicator in the bottom panel takes the rate of change of this ratio and then looks for extremes in this value over the prior 52 week period.
Figure 1. Rydex Leverage Bull v. Leverage Bear
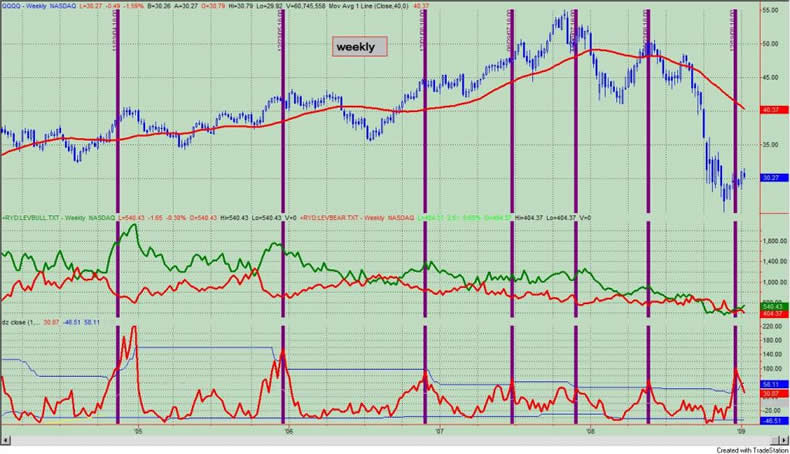
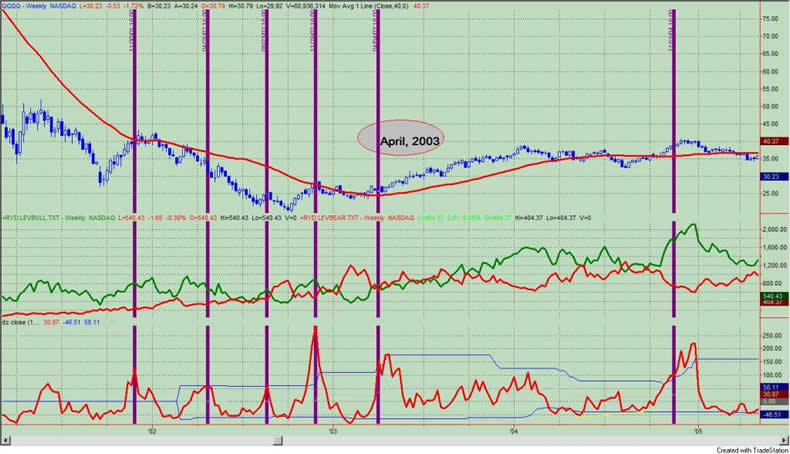
As you can see, the indicator has been above the upper band for several weeks now. Prior instances of the indicator being above the upper band have generally resulted in an intermediate term top or sideways movement of prices. These are noted with the purple vertical lines. Figure 1 looks at the period from December, 2004 to the present. Figure 2 looks at the period from December, 2001 to December, 2004. With the exception of April, 2003 (which was the blast off for the bull market), this indicator has done a very good job at identifying intermediate term market tops.
Figure 2. Rydex Leverage Bull v. Leverage Bear
So let's summarize. I have presented more sentiment data suggesting an intermediate term market top. Going forward, I still need to monitor the usefulness of the Rydex asset data.
By Guy Lerner
http://thetechnicaltakedotcom.blogspot.com/
Guy M. Lerner, MD is the founder of ARL Advisers, LLC and managing partner of ARL Investment Partners, L.P. Dr. Lerner utilizes a research driven approach to determine those factors which lead to sustainable moves in the markets. He has developed many proprietary tools and trading models in his quest to outperform. Over the past four years, Lerner has shared his innovative approach with the readers of RealMoney.com and TheStreet.com as a featured columnist. He has been a regular guest on the Money Man Radio Show, DEX-TV, routinely published in the some of the most widely-read financial publications and has been a marquee speaker at financial seminars around the world.
© 2009 Copyright Guy Lerner - All Rights Reserved
Disclaimer: The above is a matter of opinion provided for general information purposes only and is not intended as investment advice. Information and analysis above are derived from sources and utilising methods believed to be reliable, but we cannot accept responsibility for any losses you may incur as a result of this analysis. Individuals should consult with their personal financial advisors.
Guy Lerner Archive |
© 2005-2022 http://www.MarketOracle.co.uk - The Market Oracle is a FREE Daily Financial Markets Analysis & Forecasting online publication.