


End of the Financial Markets Boom – Dow Jones Headed for 3000
Stock-Markets / US Stock Markets Apr 19, 2007 - 11:23 PM GMTBy: Paul_Lamont

“In a bull market and particularly in booms the public at first makes money which it later loses simply by overstaying the bull market… The big money in booms is always made first by the public-on paper. And it remains on paper. ” – Edwin Lef èvre, Reminiscences of a Stock Operator . 1923.
To the investment community the sell-off in February came as a complete surprise. Readers of our report understand what is happening. In our article on October 17 th of last year, titled Credit Extreme Emotion ;
“As a result, financial institutions will come under severe strains as the credit bubble bursts. The rise of mortgage defaults will signal the beginning of this deflationary spiral. Unfortunately, interest rate markets are setting up homeowners for this exact scenario. ”
Also in 7 Reasons To Sell ,
“In addition, all 14 “Strategists” at the largest Wall Street Firms are calling for a higher market in 2007. The last time this bullish consensus occurred was at the start of 2001. The DJIA subsequently fell ~40% over the next 2 years.”
Promoters of the boom (Wall Street Firms) cannot be relied upon for independent investment advice. They profit by selling investments that are in demand. When demand is high for any investment, so is price and therefore these are not wise investments.
The Chart Wall Street Doesn't Want You to See
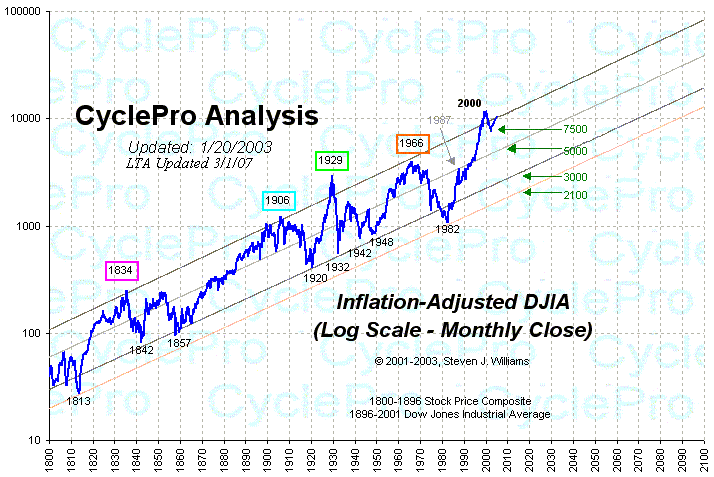
The chart above from Steven Williams at CyclePro.com shows the Dow Jones Industrial Average adjusted for inflation since 1800. As you can see, when the effects of inflation have been extracted, the DJIA is much more cyclical than Wall Street promoters would care to admit. In optimistic peaks of 1834, 1906, 1929, and 1966 the DJIA subsequently moved to the bottom of the long term trend channel. These bear markets were either inflationary, such as the 1966-1982 bear market or deflationary such as in 1929-1932. We have also noticed that inflationary/deflationary crashes tend to alternate. We suppose this is because Mr. Market likes to fool even the bears. Today we are again at the top of the trend channel. How will we fall? Most bears remember and fear the stagflation of the 1970s. However with debt levels currently high, inflation cannot be maintained for an extended length of time. Debtors would merely file for bankruptcy or foreclosure (as they have begun recently). Instead a deflationary spiral similar to 1929-1933 or 1834-1842 is likely. It appears the rule of alternation will continue.
This chart also shows possible future levels for the Dow Jones Industrial Average. According to the trend lines followed since 1800, the DJIA could reasonably fall to 3000 by 2012. This is our target.
What's Happening Now?
Astute chart watchers have recognized that markets follow elliptical curves. Currently, we are finishing up an ellipse that started in October of 2005. Notice the chart of the DJIA below, price is riding up the side of the ellipse. This is similar to price action in late 2003. (Another example of the elliptical curve is the 5yr chart of the Shanghai Index.) When price snaps out of this ellipse, the DJIA will be pursuing a new direction: down or sideways. Of course, readers know our bias is down. We believe the decline will be swifter than February's sell off.
Institutions on a Bubble
Bank failures in the Great Depression were caused by savings lost in the stock market bubble. Today our banks are prevented from investing in the stock market, instead restricted to a “safer” asset class: real estate. To see the illiquid bubble that some of our financial institutions are now dependent on, see the chart below of U.S. home prices adjusted for inflation back to 1890.
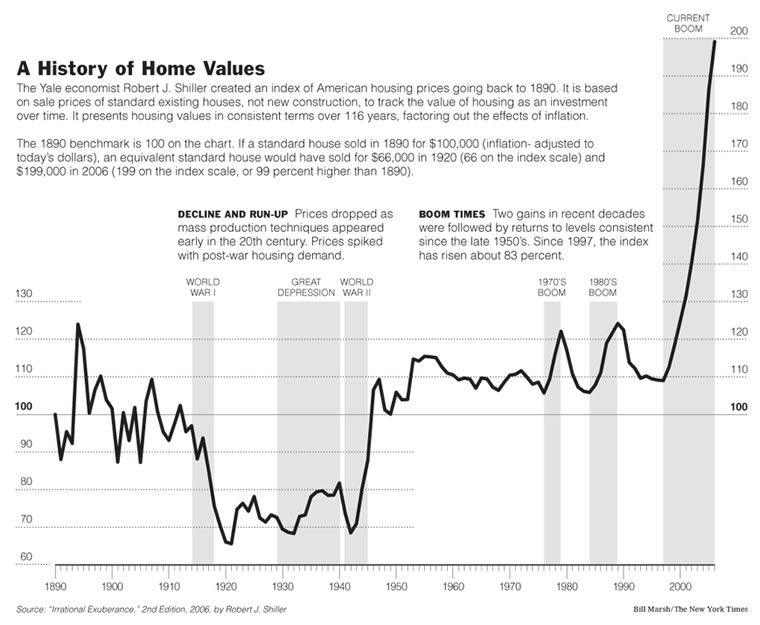
Speculativebubble.com has created a rollercoaster video of this chart, which we recommend because it reflects the emotional aspect of markets. Financial institutions that are based on the real estate market will face serious problems as the boom unwinds. Mortgage lenders are already going bust. As home prices continue to fall, aided by regulatory and market restrictions on credit, baby boomers will put investment properties, in which they hold little equity, on the auction block. Alt-A mortgages which fueled these properties will fall in value. Current ‘thinking' is that financial institutions have passed on much of the mortgage risk to hedge funds. However when hedge funds fail, ‘prime brokers' historically have been forced to accept the hedge fund's losing positions. Illiquid arrangements (for instance credit derivatives) will then be the responsibility of the prime brokers. They will be forced to sell at any price as they try to prevent losses on their own books. As the editor of The Commercial and Financial Chronicle in November of 1929 reported on the Great Crash, ‘the crowd didn't sell, they got sold out.' The trading desks of the Wall Street Firms will cash out as the panic develops, the lady in Omaha will be stuck on the phone with a busy signal.
The LTA Treasury Bill Account
To avoid this, investors should be moving now to financially healthy institutions and buying U.S. Treasury Bills. Access to funds will be critical when it is time to buy. Waiting on funds from financial institutions in bankruptcy receivership, cash redemptions of fund companies, or for FDIC payouts will be real headaches in a credit crunch. Instead a Treasury bill, a direct loan to the U.S. Federal Government, is available in the most extreme circumstances. According to the FDIC ;
“ Customers who hold Treasury securities purchased through a bank that later fails can request a document from the acquiring bank (or from the FDIC if there is no acquirer) showing proof of ownership and redeem the security at the nearest Federal Reserve Bank. Or, customers can wait for the security to reach its maturity date and receive a check from the acquiring institution, which may automatically become the new custodian of the failed bank's T-bill customer list (or from the FDIC acting as receiver for the failed bank when there is no acquirer).”
***Starting in July, our free monthly investment analysis report will require a subscription fee of $40 a month for non-clients. Clients with assets under management will receive reports free of charge. Until July, current free readers may ‘reserve their seat' here for half price ($20 a month). A yearly PayPal billing notice will arrive in an email in late June.***
By Paul Lamont
www.LTAdvisors.net
At Lamont Trading Advisors, Inc. we specialize in the management of risk and preservation of wealth. Visit our Current Strategy section for information on our asset allocation recommendations or Contact Us if you would also like to be notified when our investment analysis reports are published.
Copyright ©2007 Lamont Trading Advisors, Inc. Paul Lamont is President of Lamont Trading Advisors, Inc., a registered investment advisor in the State of Alabama. Persons in states outside of Alabama should be aware that we are relying on de minimis contact rules within their respective home state. For more information about our firm visit www.LTAdvisors.net , or to receive a copy of our disclosure form ADV, please email us at advrequest@ltadvisors.net, or call (256) 850-4161.
© 2005-2022 http://www.MarketOracle.co.uk - The Market Oracle is a FREE Daily Financial Markets Analysis & Forecasting online publication.