Great Depression 2009 Follows $30 Trillion Deflation
Economics / Economic Depression Dec 22, 2008 - 03:33 PM GMTBy: Kurt_Kasun
 Not Your Grandfather's Depression - It will be much worse, in many respects.
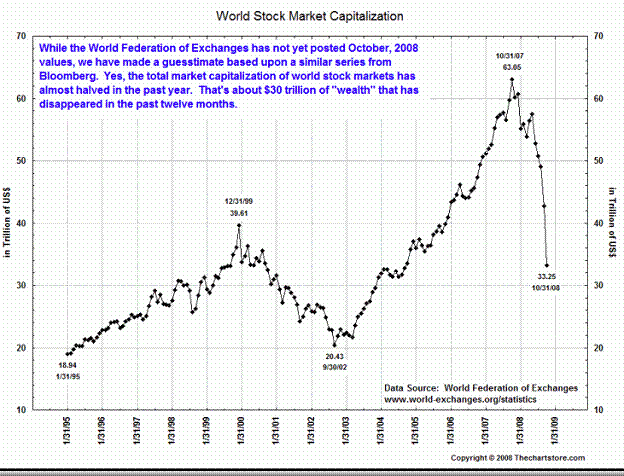
The chart below, borrowed from Dr. Marc Faber's Market Commentary December 1, 2008, is devastating. The chart shows a stunning loss of $30 trillion stock market wealth around the world. By some estimates, combined losses in commodities, stocks, bonds, real estate are greater than $60 trillion. This is beyond rescue.

Chart Courtesy Marc Faber Market Commentary and TheChartstore.com
It is virtually impossible to overstate the dire consequences resulting from the severity of the declines recently experienced in almost all asset classes—from both a technical and fundamental viewpoint. From a fundamental perspective US consumers had come to rely on borrowing against growing asset prices to sustain their lifestyles. Most of today's globally-interconnected economy was based upon growth in the US consumption. This game has ended badly. Asset dependency will eventually be replaced by living off of income and savings, but not after we escape from this disastrous period. As unemployment rises income generation will become increasingly difficult, and we cannot begin to save until our mountainous debt is paid off. For most of us, this is the equivalent of the world being turned upside down on our heads.
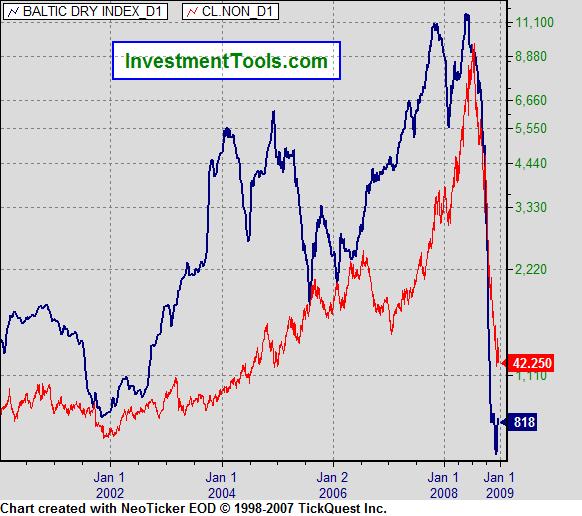
From a technical perspective, the picture is equally as dire. Take a look at the chart below of the Baltic Dry Index and of crude oil.

Collapses of this magnitude do not recover until after elongated periods of basing and repair – eye-catching, sharp, short-term bounces, yes; runs back to new highs, no. This is true for most all commodities with the exception of precious metals. It now appears that the end of decade “flameout rally” I had been predicting in previous commentary ( http://www.greenfaucet.com/commodities/.. and http://www.greenfaucet.com/the-market/..) is now in the rear view mirror. The rally did not extend as the equity rally had the end of last decade because the gains contributed to a crashing economy and the deleveraging process disproportionately punished them. Unlike gains in equity prices which tend to extend economic gains due to the wealth effect, gains in commodities prices tend to harm economic growth in a stock-market-dependent economy.
Retracement levels (corrections within the bull runs) are common – typically 38%, 50% and sometimes 62%. Drops exceeding 50% draw a major red flag and those greater than 62% are “uninvestable” in my playbook. Having said that, they are not untradeable. In fact, you can register spectacular gains if you are nimble enough to take advantage of oversold rallies before the next downtrend.
The point I wish to emphasize here, however, is that the secular uptrend that has been in place for commodities, real estate and world equities has ended. Moreover, anything that has not yet crashed most likely will. The US stock market indices are on the cusp of a major collapse. World sovereign debt is in the final blow-off phase of their bull runs and they will be the last to fall. And just before they do, the real mad scramble to own gold will begin. We are now beginning to see gains in gold and treasuries, a rare though not unprecedented occurrence.
Equally rare are drops of 48% in the DJIA and S&P 500. Market historians and technical analysts look to 1929, 1938, and 1974 for comparisons. 1929 marked the beginning of a deflationary depression. The market dropped in the late fall in bounced almost 50% into the spring of 1930 before dropping another 90% into 1932. 1938 was not quite as perilous as stocks bounced and stabilized in 1939 and then consolidated and based until 1942, ending the bear that began in 1929. In the 1974-1975 period stocks dropped 48% and then actually pivoted higher to challenge the 1968-high by the end of the decade.
I am quick to dismiss drawing a comparison to the 74-75 period because, though treasury yields slipped lower, they did not go to zero, and there was minimal debt and deleveraging by comparison. 2008 and 1938 are similar in that both saw drops of similar magnitude after having experienced cyclical bull runs which followed a market crash 8 years prior (2000 and 1929). Where this comparison falls short is that we will not have experienced a 90% collapse along the way. I believe that such a collapse is necessary and inevitable. We are therefore likely to have our 90% correction in 2009 rather than in 1930-32 period. The good news is that we are likely in the 1938-period in terms of overall duration of the bear market which means that it will likely end in four years.
The chart below is helpful in illustrating the periods of comparison.
![[Dow Jones Industrial Average, weekly closes]](../images/2008/great-depression-2009_image006.gif)
Chart courtesy: The Wall Street Journal
The chart is from a Wall Street Journal article written today by E.S. Browning titled “Stock Investors Lose Faith, Pull Out Record Amounts”. One of the great pearls of wisdom Browning shares in the article serves as a precursor to the stampede out of the market we have yet to experience: "'For many investors, this has been a glimpse into the abyss,' says Terrance Odean, a finance professor at the University of California, Berkeley, who has studied the behavior of individual investors. ‘They have been told that if you save regularly for retirement and buy and hold, you will be fine. Now, people see a possibility that this will not be the case.'" The hopeless optimists will once again wrongly argue that the negative sentiment is a bullish contrarian indicator and that now is time to buy…it's always time to buy for them.
The problem is that what investment advisors, chartered financial analysts, and economists are taught does not apply in the current environment. If we have learned anything from our current predicament it is that we cannot rely on the ‘experts for guidance. No, history is our best teacher. Just as policy-makers knew that they had the tools to prevent the depression, similar expectations hold for the “dream-team” of economists Obama has assembled to form his economic policies.
In a December 21 Washington Post article titled “Optimism High About Obama Policies, Poll Finds” written by Jon Cohen and Jennifer Agiesta we find that “Most Americans are optimistic about the policies that Barack Obama will pursue …according to a new Washington Post-ABC News poll….Majorities think Obama should help make major changes to the health-care system, enact new energy policies and institute a moratorium on home foreclosures. Majorities expect him to end U.S. involvement in Iraq, improve health care and turn around America's image abroad.”
Those polled are in store for major disappointment. Ian Gordon, in The Long Wave Analyst Special Addition “This is It!” August - November 2007, warns us:
“Regrettably, many people believe that their leaders can always positively control the future. It is a mistaken belief that always costs them dearly. Every market move is always followed by a reaction. The bigger the up move the bigger the down side. There is no historical comparison with the sheer magnitude of the worldwide investment mania that is currently in force. Thus, the down side threatens to rock the very foundations of capitalism and democracy. As Epicitus put it, ‘the extreme of any position will ultimately become its opposite.' As night follows day, a boom is always followed by a bust; the bigger the boom the bigger the bust. The bust always catches the majority unawares, coming as it does from a zenith of apparent prosperity and speculative excess. At this time, the crowd is imbued with an impetuous fervor encouraged by the affirmations of its leaders.”
The erroneous interpretation that FDR's government programs combined with accommodative monetary policy led us out of the Great Depression will result in policies that destroy the currency. It is of little value to debate what should be done, because this is what will be done. Dr. Marc Faber in his latest Market Commentary correctly surmises, “I have repeatedly characterized the current economic conditions as comparable to a war being fought between central banks around the world and the private sector and that this war is likely to be very protracted and will lead to high volatility in all asset classes. We have seen that governments are desperate to support asset markets with “extraordinary” and unprecedented monetary and fiscal measures…”
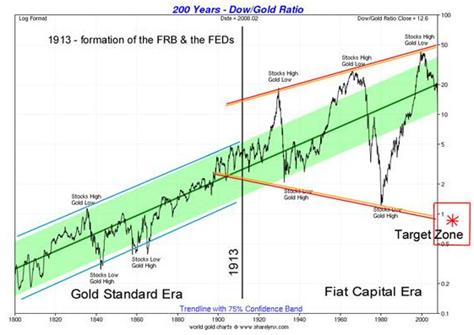
The ill-fated measures will fail and do more harm than good. My interpretation of the charts leads me to conclude that the DJIA will correct all of the way back down to the level of the start of the last secular bull market which began in 1982 of 1000. A similar drop to the 100-level in the S&P 500 is to be also be expected. Gold will resort to its status as a currency and all currencies will deflate against gold. The price of gold will likely top out at a price higher than $1000/oz as the ratio of Dow-to-gold dips below 1:1 as indicated in the chart below:

Chart Courtesy: sharelynx.com
I think it will dip to 0.2:1 which would place gold around $5000/oz which might be enough to peg currencies to account for the world's remaining wealth. The sooner they peg, the sooner they stabilize the loss in wealth. What is missed on many historians is that the Producer Price Index actually rose throughout the 1930s (moderately) and real rates remained negative. Real rates are likely to remain positive today which is why gold will eventually become the last asset class of choice as those who still have some wealth desperately seek to preserve it. Faber notes, “…I doubt that considering the large and growing budget deficits and the costs associated with the various bailouts the US will ever again have positive real interest rates – at least not until the system breaks down and a new monetary order is introduced, which will be run by real central bankers (ideally even without them) and will not be managed by some academics who in their insanity have become money printers.”
Many have written that this is not “your garden-variety recession.” We are well beyond recession terms. This will be worse than your “Grandfather's Depression”. It will end with the destruction of the US dollar as the world's reserve currency and return us to a gold-backed world currency regime. A sound world currency will allow us to once again grow the economy through savings and investment in a sustainable manner. Ian Gordon observes that:
“The great Austrian School Economist, Ludwig von Mises wrote, ‘There is no means of avoiding the final collapse of a boom brought about by credit expansion. The question is only whether the crisis should come sooner as a result of a voluntary abandonment of further credit expansion, or later as a final and total catastrophe of the currency system involved.' There has never been any attempt to abandon the credit expansion. Indeed any crisis was simply an excuse to open the monetary spigots. This, then, is the beginning of the total catastrophe of the American dollar, indeed the entire world monetary and financial structure.”
Those who continue to place their faith in our policy representatives will be among the most unprepared as Gordon further cautions:
“That so many people trust in the power of their leaders to offset the natural progression from boom to bust in the economy is incredible. It can be demonstrated time and time again that leaders have always failed in their quest to arrest economic and financial decline. In fact, the more that these leaders believed in their power to maintain the status quo, the greater the ultimate damage and the greater the suffering endured by the people who had blindly placed their trust in them. “
The current period will be more about preserving wealth than creating it. Your financial plan will require more of an emphasis on paying off debt, saving, and slashing your budget than it will on investing and designing a well-crafted diversified portfolio. Most financial advisors are going to need to be re-trained. Unfortunately for them , many of the firms they are working for will not exist in a few years.
By Kurt Kasun
A contributing writer to GreenFaucet.com , Kurt Kasun writes a high-end investment timing service, GlobalMacro, which is focused on identifying opportunities that produce returns in excess of market with reasonable risk. He is strategically located in Washington , D.C. , a key to maintaining contacts and relationships which help Kurt understand global policy and economic factors as they emerge. His investment approach has always been macro in nature largely due to his undergraduate studies at the U.S. Military Academy at West Point (B. S. National Security, Public Affairs, 1989) and his graduate studies at George Mason University (M.A. International Commerce and Policy, 2006).
Disclaimer: The above is a matter of opinion provided for general information purposes only and is not intended as investment advice. Information and analysis above are derived from sources and utilising methods believed to be reliable, but we cannot accept responsibility for any trading losses you may incur as a result of this analysis. Individuals should consult with their personal financial advisors before engaging in any trading activities.
Kurt Kasun Archive |
© 2005-2022 http://www.MarketOracle.co.uk - The Market Oracle is a FREE Daily Financial Markets Analysis & Forecasting online publication.


