The Greatest Wealth Transfer in the History of Mankind Starts Now!
Interest-Rates / Economic Depression Dec 19, 2008 - 11:40 AM GMTBy: Brent_Harmes

 Right now, the Treasury, the Federal Reserve, and the banking system seem to be gearing up for an event the likes of which has never been seen. I believe the crisis that will unfold over the next few years will add up to the biggest economic event in history. The scale of what is happening will dwarf all other economic events combined. The Tulip mania of 1637, John Law's "Mississippi Scheme" of 1720, and the dot-com / tech bubble of 1999 will pale by comparison. Even the hyperinflation in Weimar Germany in 1923 and the Great Depression will seem like a walk in the park compared to what is coming.
But wealth is never destroyed - It is merely transferred. Neither you, nor I, have the power to stop what is coming. But we do have the choice to either freeze in panic and be crushed under the wheels of the economic freight train that is bearing down upon us, or catch the ride of our lives on the road to immense wealth.
While speaking at a recent wealth conference in Florida, I showed the audience some charts to try to impress upon them the enormity of what is going on right now! The chart I call my Panic Meter is made up of LIBOR rates (the rate which banks lend to each other) divided by the 3-Month Treasury Bond yields. By dividing LIBOR rates by bond yields you get a measurement of just how panicked the banks and large investors really are. This chart is saying that something is really, really wrong.
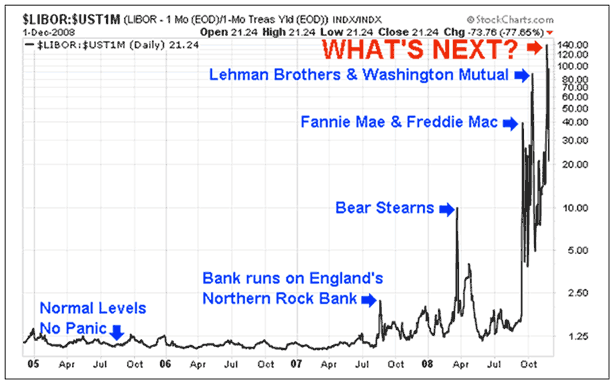
Panic Meter (2006 - November, 2008)
I then showed a chart of the monetary base (all paper dollars and coinage in existence). It took 200-years for the monetary base to go from $0 to $800 billion, but in just the past 3-months it has grown from around $800 billion to $1.5 trillion, and by the time you read this it will probably be surpassing $1.6 trillion. That's double the number of paper dollars in existence since last summer!
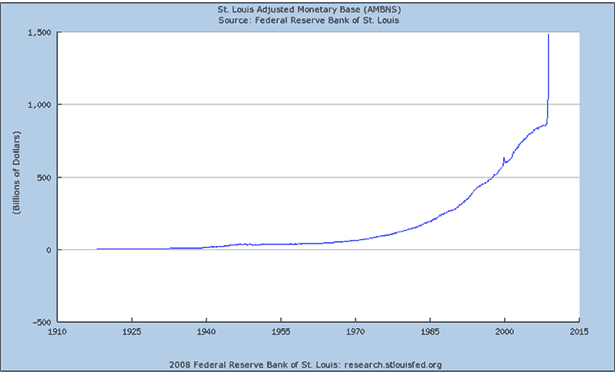
Base Money (1919 - November, 2008)
But here are a few charts that I didn't show at the conference...
The next chart is "Cash in Circulation". So far only a small amount of all that extra currency shown in the above chart has leaked out of the banking system and into circulation. But you can bet your assets... IT WILL. When it does, it means that prices must rise to soak up all that extra currency, like a sponge soaking up water. This is bad news for someone holding dollars, but cause for celebration for a precious metals investor.
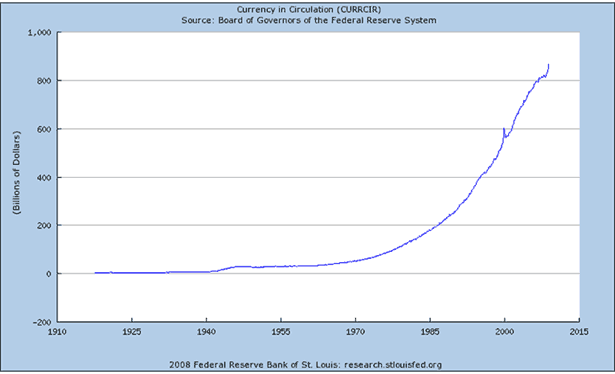
Currency in Circulation (1919-November, 2008)
Here is a chart of how many dollars the banks have borrowed from the Federal Reserve through the end of last year (2007). Please note the spike that indicates the banks had to borrow $8 billion from the Federal Reserve during the Savings and Loan Crisis of the late 1980s.
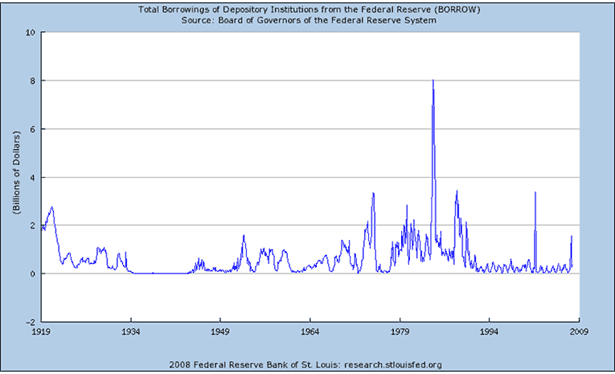
Bank Borrowings from Federal Reserve (1919-2007)
Here is the same chart, but I've now taken it out through November of 2008. You can't even see the $8 billion S&L Crisis peak anymore! In fact, the banks are approaching $800 billion in borrowings. This means that the banks perceive this crisis as being 100 times larger than the S&L crisis.
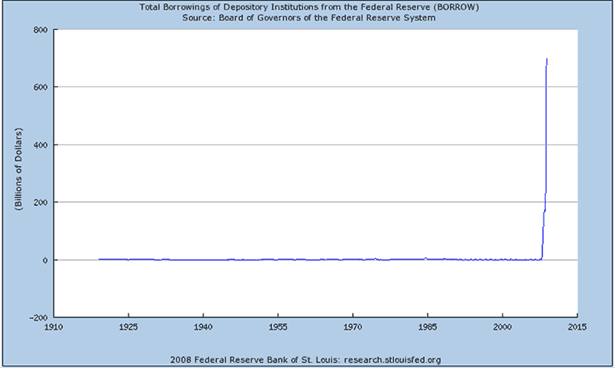
Bank Borrowings from Federal Reserve (1919-November, 2008)
This next chart is Reserve Bank Credit. It is the total amount the Federal Reserve has loaned out of its bottomless checkbook. This chart includes all the rest of the bailouts (at least through November 2008). This chart also rises to roughly $800 billion by the end of 2007, but by November 2008, it has risen to $2.2 trillion. As Brent Harmes would say "It's climbing skyward like a homesick angel."
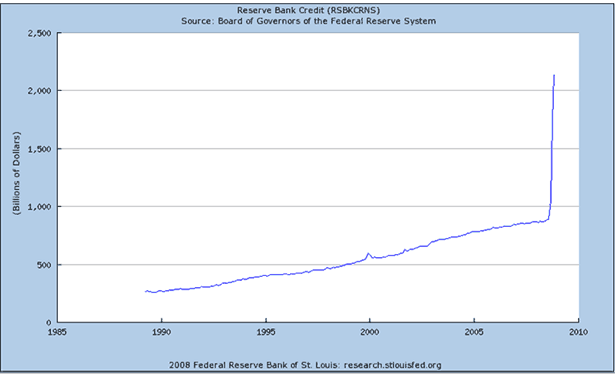
Reserve Bank Credit
Last, we have a chart of "Excess Bank Reserves". These are reserves in excess of the amount that the Federal Reserve requires the banks to have. It looks almost identical to the chart of Bank Borrowings, except for two small features; there is a tiny blip in 2001 and a small bump around 1941. Could it be that the banks perceive this crisis to be 50 times larger than 911 or even World War II?
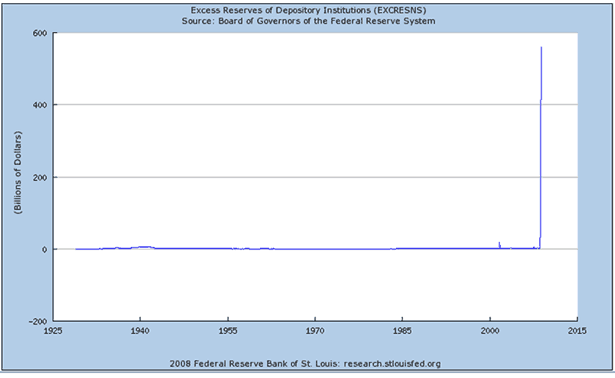
Excess Bank Reserves (1930-November, 2008)
With the exception of the Panic Meter, all graphs in this article are taken directly from the Federal Reserve's website. Personally, I'm pretty sure that in a few years a chart of the price of gold will look similar to these charts, and a chart of the U.S. dollar will look like one of these charts flipped upside-down.
If you don't believe me, just take a look at this!
Bloomberg, Dec. 15 - Dollar Staggers as U.S. Unleashes Cash Flood:
"U.S. policy makers are flooding the world with an extra $8.5 trillion through 23 different plans designed to bail out the financial system and pump up the economy. The decline ( of the dollar ) shows that the increased supply of money may be overwhelming investors...."
In my book, " Rich Dad's Advisor's Guide to Investing in Gold & Silver ," I show how virtually every time governments, and/or the banking system, abuse a currency enough to push it to a tipping point (such as in these charts), the free market and the will of the public revalue gold and silver to account for the excess currency that was created since the last time they were revalued. But this time, for history to repeat, and for gold to do what it did in 1980, 1934, and hundreds of times throughout the world going all the way back to Athens in 407 BC, it will require a gold price of over $10,000 per ounce... And that's if they turn off the printing presses today!
I believe this is the greatest opportunity ever offered to anyone in the history of mankind! Gold below $1,000 and silver in the $10 range is a gift from God. You can ignore this gift at your own risk, or graciously accept it and be on the road to great abundance. I don't know about you... but I'm buying lots of gold and silver.
Things I believe every investor should do:
Step 1: Get educated. Don't take my, or anyone else's, word on this. Read books and newsletters on the subject and decide for yourself.
Step 2: Buy physical gold and silver and take possession of it (or have it stored at a third party depository).
Step 3: Avoid "Fools gold" such as:
- ETF's, pool accounts, futures contracts, leveraged accounts etc. Many of these are just "paper contracts" with little or no gold or silver behind them.
- Collector coins with excessive premiums above the worth of their metal content. These are a better deal for the dealer than for you.
Step 4: Relax knowing you have protected your wealth and positioned yourself to profit greatly from what history tells us is inevitable.
By Michael Maloney
GoldSilver.com
Michael Maloney is a precious metals expert, monetary historian, author of "Rich Dad's Advisor's Guide to Investing in Gold & Silver, and the founder of GoldSilver.com
GoldSilver.com is an online precious metals dealer that specializes in delivering gold and silver to your door or securely storing it for you in a Brink's precious metals storage account.
To read the book that predicted the current financial crisis and what will happen next, check out Michael's book " Rich Dad's Advisor's Guide to Investing in Gold and Silver ". (Amazon $11.55)
By Brent Harmes
Subscribe or Manage Your Newsletter Subscription Here | Buy Gold and Silver Online
Copyright © 2008 Brent Harmes
GoldSilver.com offers vault storage accounts at Brinks Security in Salt Lake City, Utah. The minimum investment required for vault storage account is 20 ounces of gold or 1,000 ounces of silver. For more information call us at: 702-799-9000
Disclaimer : All claims made by GoldSilver.com should be verified by the reader. Investing is not suitable for everyone and readers are urged to consult with their own independent financial advisors before making a decision. Past performance is not necessarily indicative of future results. GoldSilver.com will not be liable for any loss or damage caused by a reader's reliance on information obtained in any of our newsletters, special reports, email correspondence, or on our website. Our readers are solely responsible for their own investment decisions.
Brent Harmes Archive |
© 2005-2022 http://www.MarketOracle.co.uk - The Market Oracle is a FREE Daily Financial Markets Analysis & Forecasting online publication.


