Critical Week for Global Stock Markets and Economic Recovery
Stock-Markets / Global Stock Markets Nov 17, 2008 - 02:04 PM GMTBy: John_Derrick
 We have pointed out several times that we think the recovery from the current recession will be U-shaped, with several tests of the low before a likely bottom is reached and a sustainable rally can begin.
According to recent research from JP Morgan, the next week or so could be an important period of time for the stock market.
This research is based on the S&P 500's intraday low of 838 on October 10, which had been the index's lowest point prior to Thursday's intraday low of 818.
JP Morgan examined more than a century of bear markets to look for recovery patterns and came up with a few interesting observations. It found that market bottoms are almost always retested, and that such retests result in a new low about 40 percent of the time.
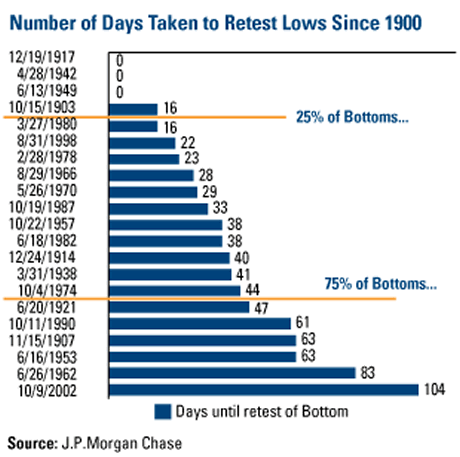
History shows that three-quarters of the retesting events occurred within 44 days of a bottom, so if the October 10 low in fact marked a bottom, a retest (which could create a new low) should be expected prior to November 23.
The longest span for retesting a low was 104 days in 2002. A repeat of that extreme case would schedule the retest for January 22, 2009.
Of course, JP Morgan makes no promises that October 10 is the pivotal date. One of its causes for concern is market volatility, as measured by S&P's intraday swings. As an example, Thursday's swing – a high of 913 and the 818 low – was more than 10 percent of the index's value.
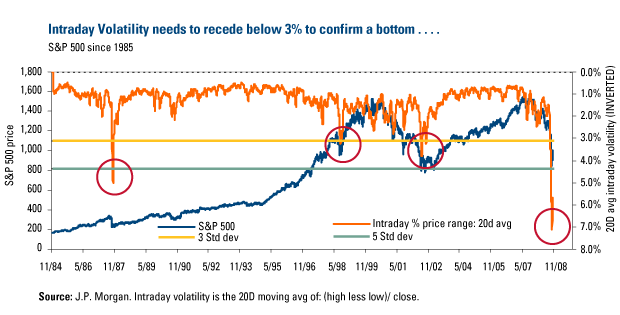
The rolling 20-day intraday volatility reached 7 percent and is currently running around 5 percent, as noted on the above chart. JP Morgan says that level has to come down to 3 percent to attract institutional investors who are now sitting on the sidelines.
If the current trend continues, the 3 percent level would be reached, you guessed it, on November 23.
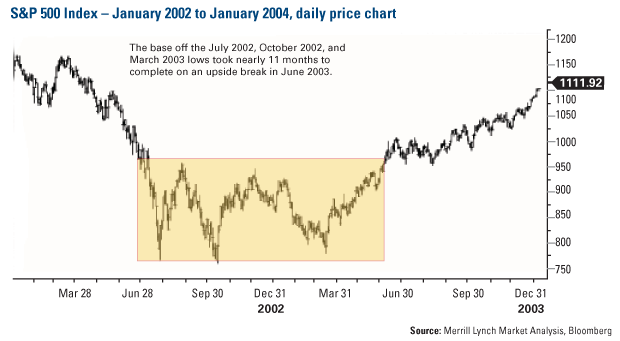
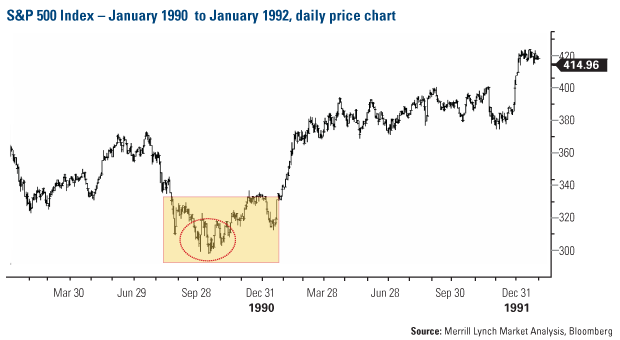
This week's research reinforces the U-shaped bottom that we're envisioning. The past three bear markets have followed that pattern, as you can see on the charts below.
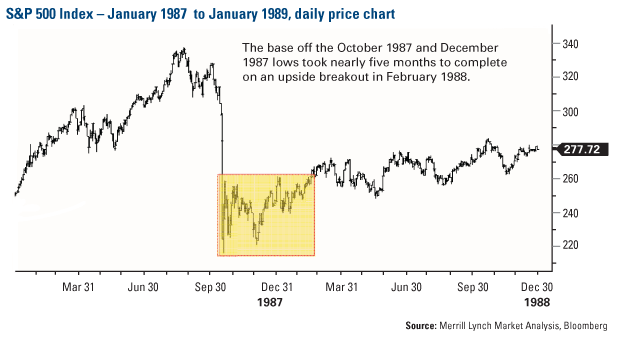
Another measure that points toward possible market capitulation is the CBOE's Volatility Index (VIX) (10), also known as the Fear Index. The VIX hit a number of all-time highs in October before peaking late in the month. It has since fallen roughly 25 percent, suggesting that investor fear may be ebbing and raising the chances of a sentiment reversal.
Stock market volatility hasn't been confined to the U.S. The chart below shows that the extreme downside volatility in the Asia region ex-Japan has exceeded the Asian financial crisis in 1997 and the Russian default in 1998 that led to the collapse of the Long-Term Capital Management hedge fund.
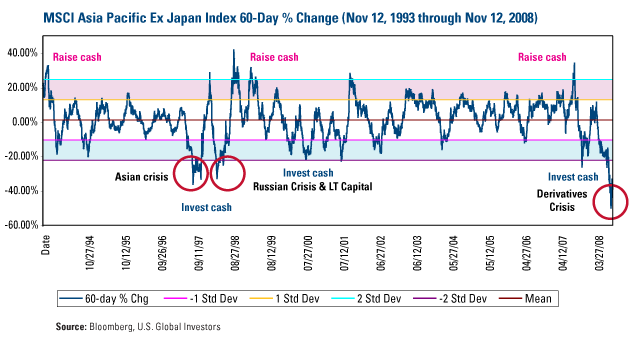
The potential for mean reversion in equity prices is substantial as the chart above displays. Using the last two crises as our guide, the rebound toward the mean tends to occur over a short period of time and with great alacrity. Just to return to the mean in the near term would require a positive move greater than 30 percent.
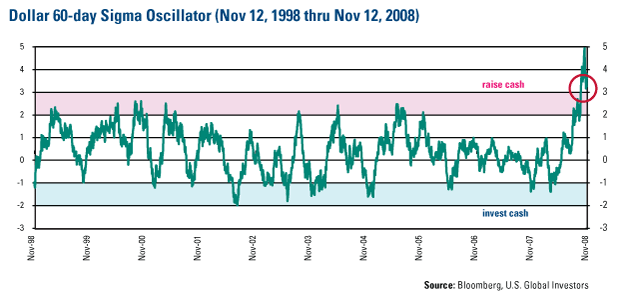
The opposite situation is in effect in the chart above. Short covering, deleveraging and forced repatriation have been significant factors in the U.S. dollar appreciation and emerging market depreciation, driving the U.S. dollar to an upside extreme. When this deleveraging cycle runs its course, mean reversion will take effect for both the dollar and emerging market stocks.
Warren Buffett recently took the initiative to offer investors some good advice -- “Be fearful when others are greedy, and be greedy when others are fearful” – and some good perspective – “The market will move higher, perhaps substantially so, well before either economic sentiment or the economy turns up.”
These words of wisdom from the Oracle of Omaha definitely hit home in today's markets, and give us reason for optimism.
By John Derrick
John Derrick, CFA, is director of research at U.S. Global Investors, which manages mutual funds specializing in natural resources, emerging markets and global infrastructure.
For more insights and perspectives from the U.S. Global Investors team, visit CEO Frank Holmes' investment blog “ Frank Talk” at www.usfunds.com/franktalk .
Please consider carefully the fund's investment objectives, risks, charges and expenses. For this and other important information, obtain a fund prospectus by visiting www.usfunds.com or by calling 1-800-US-FUNDS (1-800-873-8637). Read it carefully before investing. Distributed by U.S. Global Brokerage, Inc.
All opinions expressed and data provided are subject to change without notice. Some of these opinions may not be appropriate to every investor. Gold funds may be susceptible to adverse economic, political or regulatory developments due to concentrating in a single theme. The price of gold is subject to substantial price fluctuations over short periods of time and may be affected by unpredicted international monetary and political policies. We suggest investing no more than 5% to 10% of your portfolio in gold or gold stocks. The following securities mentioned in the article were held by one or more of U.S. Global Investors family of funds as of 12-31-07 : streetTRACKS Gold Trust.
John Derrick Archive |
© 2005-2022 http://www.MarketOracle.co.uk - The Market Oracle is a FREE Daily Financial Markets Analysis & Forecasting online publication.


