


Stock Market Showing Signs of a Tradeable Low
Stock-Markets / US Stock Markets Nov 16, 2008 - 10:18 PM GMTBy: Andre_Gratian

 Current Position of the Market
SPX: Long-term trend -
Down! The very-long-term cycles have taken over earlier than anticipated and if they make their lows when expected, the bear market which started in October 2007 should continue until 2012-2014.
SPX: Intermediate trend - There is a target of about 795-800 for the ending of the current phase of the decline. This target should be met next week. However, one cannot say for certain that a reversal will lead to a lasting rally.
Analysis of the short-term trend is done on a daily basis with the help of hourly charts. It is an important adjunct to the analysis of daily and weekly charts which determines the course of longer market trends.
Daily market analysis of the short term trend is reserved for subscribers. If you would like to sign up for a FREE 4-week trial period of daily comments, please let me know at ajg@cybertrails.com .
Overview:
Since the last writing, we had another two weeks of high volatility during which the low of October 10 was undercut intra day, and immediately followed by a substantial rally similar to that of 10/10, but the main difference between the two was that the second rally fizzled on the very next day and prices began to head down again at Friday's close.
For some time I have said that there was an SPX Point & Figure target to 795 which was reinforced by several Fibonacci projections pointing to the 800 area, and that these would likely be met in October or November. It looks as if the SPX is about ready to reach its destination at the prescribed time. The coming week should see the fulfillment of the target and a reversal.
But what kind of a reversal? Perhaps something less than desired! Already, lower projections to about 600 extending into January are being ventured. I could not find any way to verify these targets, but my estimate of 800 could be conservative, and it would not surprise me if we kept going to the mid or even low-700's before we had an intermediate reversal. The most extreme Fibonacci projections reach into these areas.
It's a little difficult to predict what form the decline will take during the course of the long-term bear market which lies in front of us for the next four years, and I know that we are not psychologically prepared for it, having lived during times of bull markets and much higher prices. In spite of the price deterioration which has already taken place, those who expect a quick ending to this bear market are going to be disappointed. There is a lot more to go, both in time and in lower prices.
What's ahead?
Chart pattern and momentum:
The SPX is once again approaching the low of what appears to be its primary trend channel. Last Thursday, it already made a new low from which it rebounded immediately, but resumed the decline on Friday with a 44-point drop in the last hour of trading. This type of action tells us that we still have more to go, and since the projection is 795-800, there is a good chance that we will see the target met by the middle of the week in conjunction with a nest of cycles due to make lows, including the 9-mo cycle.
Having not gone through a severe bear market with the daily indicators before, I was not sure how they should be interpreted under the circumstances. But it looks as if they work nearly the same as they would during normal markets. We started the last decline when both indicators had reached extreme overbought levels, and reversed. While they are still going down, they may have to reach slightly deeper oversold levels before the index can turn, but the main thing to notice is that they are already showing positive divergence which indicates that the low is very near, time-wise.
The NDX ( which follows) looks pretty much like the SPX, but it has already challenged its lower channel a number of times and looks as if it is ready to go through it once again. So the shape of its primary channel may change before an intermediate bottom is reached.
Prices are also beginning to accelerate downward at a steeper rate in the blue channel, and we may not be able to confirm these trends and channel lines as valid until a solid bottom has been found. Although the divergences that are beginning to appear in this chart also tell us that the low is not going to be too far away.
Cycles
A number of short-term and intermediate-term cycles are due around November 18/19th, along with the 9-month cycle low. This cluster of lows appearing in time with the projections and conditions described in the next sections should alert us to the proximity of a good reversal.
Projections:
A Point and Figure target of long-standing to 795 has recently been re-confirmed by another projection to the same target from a lower level.
There was a primary Fib projection down to 803 made several weeks ago, but with all the volatility around the recent lows, there are now several potentially lower projections into the 750s and 60s.
Breadth
The NYSE hourly breadth oscillator has just turned again as a result of Friday's vicious last hour reversal, but it has been making a series of higher lows (positive divergence) for the past week, and looks as if it might do so again if we do not have a protracted decline from here.
The daily indicator, as shown on the chart above, is already in a position of positive divergence.
The McClellan Summation index (below - Courtesy of Stock-Charts) is showing some good positive divergence. This is the first time that I can remember these three indicators of different time spans to be in synch with one another. Considering that we are approaching the 800 target during the time prescribed by a nest of cycles, be on the alert. This could be the week that turns this around. The only questions is: "for how long?"
Market Leaders and Sentiment
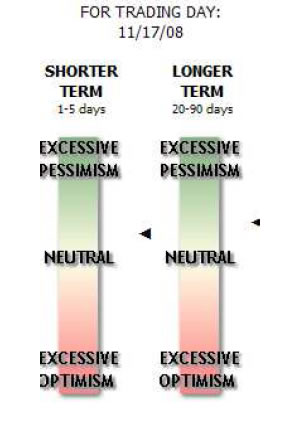
The sentiment indicator (courtesy of Sentiment Trader) is moderately bullish, more so in the intermediate term, but these readings can change for the better if we sell off for another couple of days.
These could also be construed as supporting the other indicators which are calling for a low.
Summary
We are finally arriving at a point in time which could turn things around for the Stock market.
Projections to about 800 are supported by cycles and other indicators that signal that we may be arriving at what some call "a tradable low!"
The following are examples of unsolicited subscriber comments:
What is most impressive about your service is that you provide constant communication with your subscribers. I would highly recommend your service to traders. D.A.
Andre, you did it again! Like reading the book before watching the movie. B.F.
I would like to thank you so much for all your updates/newsletters. As I am mostly a short-term trader, your work has been so helpful to me as I know exactly when to get in and out of positions. I am so glad I decided to subscribe to Turning Points… Please rest assured that I shall continue to be with Turning Points for a long time to come. Thanks once again! D.P.
But don't take their word for it! Find out for yourself with a FREE 4-week trial. Send an email to ajg@cybertrails.com .
By Andre Gratian
MarketTurningPoints.com
A market advisory service should be evaluated on the basis of its forecasting accuracy and cost. At $25.00 per month, this service is probably the best all-around value. Two areas of analysis that are unmatched anywhere else -- cycles (from 2.5-wk to 18-years and longer) and accurate, coordinated Point & Figure and Fibonacci projections -- are combined with other methodologies to bring you weekly reports and frequent daily updates.
“By the Law of Periodical Repetition, everything which has happened once must happen again, and again, and again -- and not capriciously, but at regular periods, and each thing in its own period, not another’s, and each obeying its own law … The same Nature which delights in periodical repetition in the sky is the Nature which orders the affairs of the earth. Let us not underrate the value of that hint.” -- Mark Twain
You may also want to visit the Market Turning Points website to familiarize yourself with my philosophy and strategy.www.marketurningpoints.com
Disclaimer - The above comments about the financial markets are based purely on what I consider to be sound technical analysis principles uncompromised by fundamental considerations. They represent my own opinion and are not meant to be construed as trading or investment advice, but are offered as an analytical point of view which might be of interest to those who follow stock market cycles and technical analysis.
Andre Gratian Archive |
© 2005-2022 http://www.MarketOracle.co.uk - The Market Oracle is a FREE Daily Financial Markets Analysis & Forecasting online publication.