Stock Market Catches a Bottom
Stock-Markets / US Stock Markets Nov 10, 2008 - 06:39 AM GMTBy: Jack_Steiman

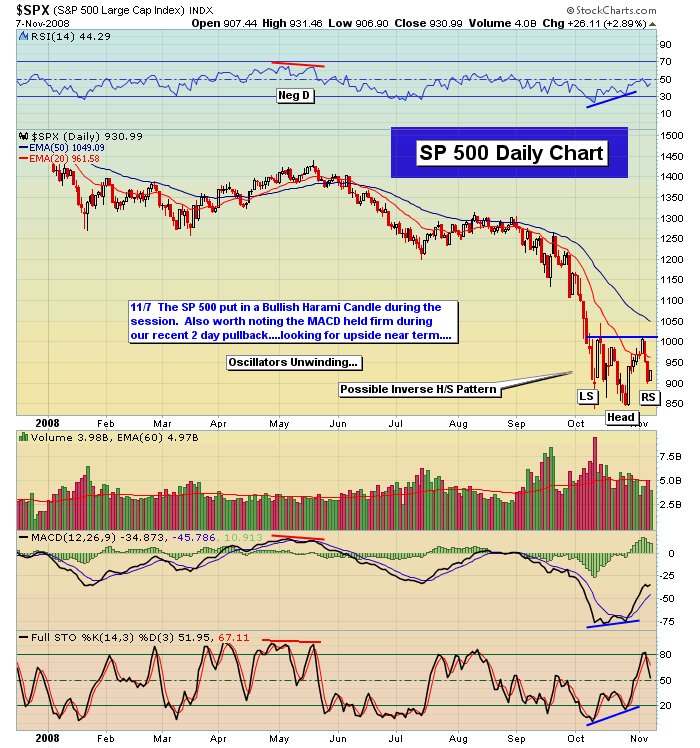
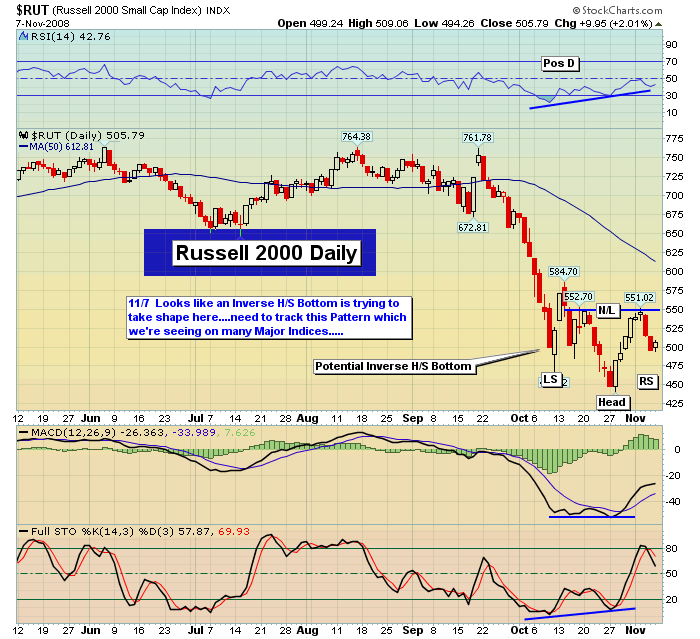
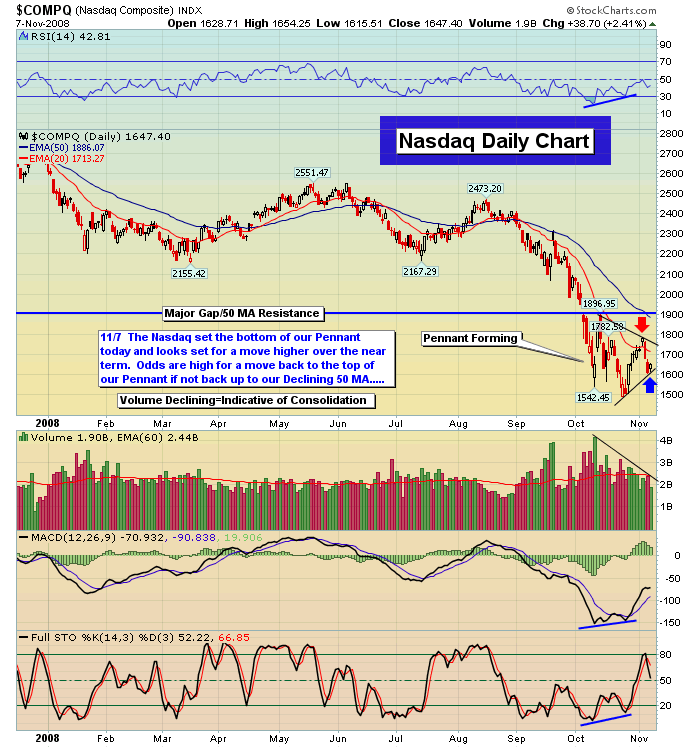
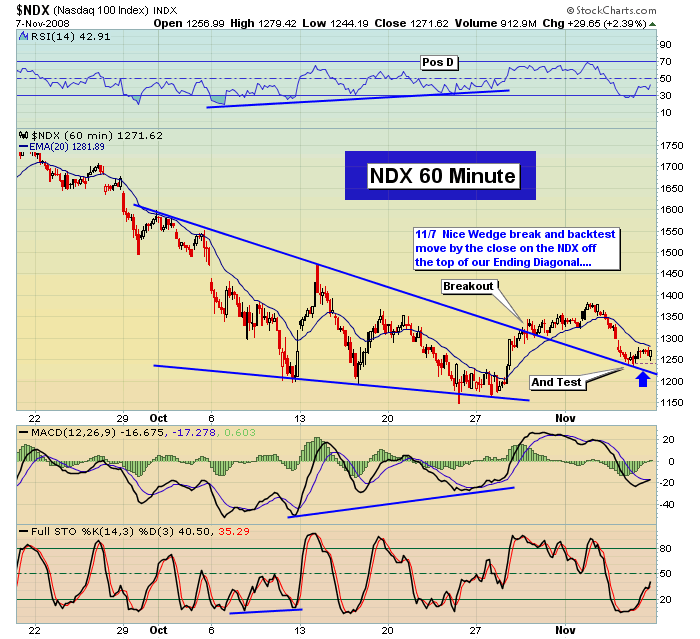
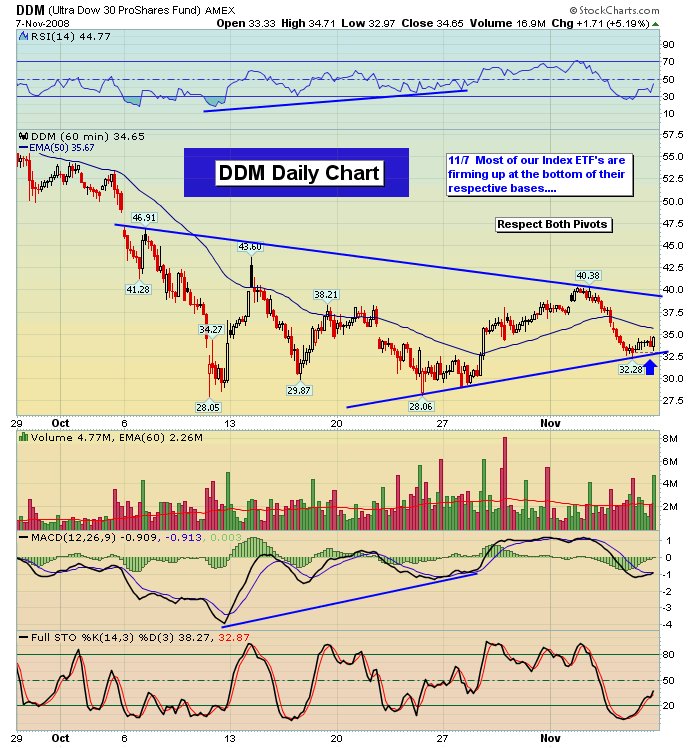
 The market is not acting as if it's ready to break down. A good catch by the bulls at the very bottom of the current triangles. I mentioned last night that the daily charts were strong and thus it can come as no surprise that we were higher today. It's so easy to say that the past two days spell doom for the markets but those daily's, being as strong as they are, were able to stop the bears from breaking this market down right at the bottom of those back and forth triangles.
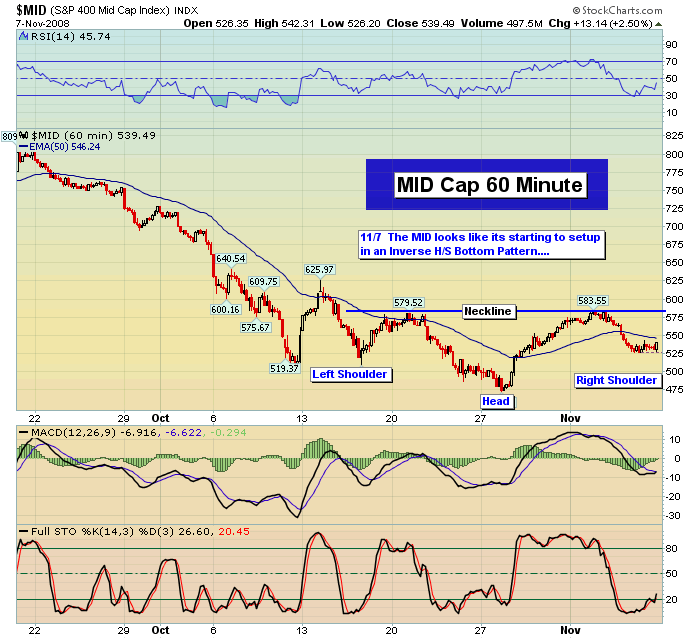
It suggests the possibility of a very decent move back up to the top of those triangle's if not higher over the next many days and weeks. In this market, that is no guarantee but the 60's, which were nasty most of the day, did improve some late and if those Macd's on the 60's can cross, and they're close, then this market will be able to move to the top of the triangle's. Those levels are decently far away and that would create a real buying opportunity for the short term. Those levels being 980 Sp and 1740 Nas.
If the top of the triangle's were to be taken out, then you're talking once again about moving to the 50's which are normally visited during a bear market but have yet to do so in this one. It's declining rapidly to meet price so it's not out of the question. 1049 is the current and steadily declining number on the Sp 50 day exponential moving average and 1886 is the number on the Nas. I know those levels seem like an unattainable dream but if we get those 60 minute crosses it's possible folks.
The top of the triangle's at least and maybe more. Monday will be a huge day to see what this market has got in it from a near term bullish perspective. If nothing else, those daily Macd's are far too bullish still to be thinking shorts. There were some elements to today's rally that didn't sit too well with me in the form of much lighter volume on the rally and once again, the leaders refusing to participate. Aapl, Goog and a whole bunch more you all know by now were either red for the day or barely green. The fact that most if not just about all of them are also at the bottom of their triangle's, it is possible that they will begin to participate on the long side starting Monday.
The Nas volume today was 500 million shares lighter than the down volume from Thursday. Not exactly the type of confirmation you're looking for when thinking a move to the top is possible near term. Through the years I have found that the single most important elements in technical analysis are the state of the daily Macd's and the type of volume the market is displaying.
The daily Macd's are powerful but volume trends aren't great thus we have a standoff there. If I have a standoff such as this I usually defer to the daily Macd's as the final decision maker and thus I do think it's more likely volume will start to improve early on next week and that the markets will move higher.
The final bug in the ointment today was an inside day was printed on that lighter volume. A day where the upside candle sticks traded within the larger downside candlestick from Thursday off a nasty two day move lower. Often the trend will continue which was lower previous to the inside day but once again, I have to defer to those daily Macd's as the decision maker. We shall see on Monday for sure. When a market wants to go higher, there is no news out there that can adversely affect the action to come for that day. The market was near breakdown and the employment report was nothing short of horrific. Every excuse was there for the bears to crush the market but after the futures fell for a quick moment, they recovered quickly and the buying was on for the day. Late selling came in which took down much of the gains but with fifteen minutes left the bulls came in and ramped the market in to the close allowing the indexes to close at or just shy of their highs for the day.
The employment report was worse than even the most pessimistic prognosticators had forecast. Didn't matter because those daily's said it was rally time and nothing was getting in the way of that. It's never about the news. It's about where the market needs to go at any given moment of time. The longer term is very unclear. How we might advance now and in the days ahead will tell us some of that story meaning how those oscillators behave but for now it's just too early to know how bad things may get down the road. In a market environment such as this you have to take things day to day. We felt shorting on this latest two day pullback was inappropriate based on those strong daily Macd's. You have to play what you see and stay cash for as long as needed when in these triangle's but it does look like there's a small buying window upon us.
When we get to the top the market message will be loud and clear. Can we finally make a break that allows at least a 50 day moving average test or will it just quit? If we get the move to the 50's, what will the oscillators look like? We need to watch and learn from that whole process to determine whether the market has seen it's worst days or whether a lot more pain is coming down the road.
It's very unclear at this point in time and I'd be wasting your time if I said I was sure about what was to come. No one knows but we will learn a lot over the coming days and weeks for sure. Wfc (Wells Fargo) printed a nice candle today, closing well above its gap down low created by last nights news of needing to do a secondary stock offering in order to raise ten billion additional dollars above and beyond what the Fed has already given to them. It shows you how bad things really are in the credit world and for the banks. That news was bad for sure and it gapped down today and rightly so but the strong close is another sign that it's likely the market wants some real upside in the short term. The banking sector or the Bkx looks pretty good short term as well and maybe that's why it rose late in the day.
If the banks can rally near term it's very likely we get the move higher from here. Wfc a probable good tell for that rally coming up near term. Never a guarantee but that stocks action today does bode well. Have a great weekend. Spend time with a child if at all humanly possible.
By Jack Steiman
Sign up for a free 30-day trial to Jack Steiman's SwingTradeOnline. .
Jack Steiman is author of SwingTradeOnline.com ( www.swingtradeonline.com ). Former columnist for TheStreet.com, Jack is renowned for calling major shifts in the market, including the market bottom in mid-2002 and the market top in October 2007.
Sign up for a Free 30-Day Trial to SwingTradeOnline.com!
© 2008 SwingTradeOnline.com
Mr. Steiman's commentaries and index analysis represent his own opinions and should not be relied upon for purposes of effecting securities transactions or other investing strategies, nor should they be construed as an offer or solicitation of an offer to sell or buy any security. You should not interpret Mr. Steiman's opinions as constituting investment advice. Trades mentioned on the site are hypothetical, not actual, positions.
Jack Steiman Archive |
© 2005-2022 http://www.MarketOracle.co.uk - The Market Oracle is a FREE Daily Financial Markets Analysis & Forecasting online publication.


