


Gold Stock Correction Finally Hits Target
Commodities / Gold and Silver Stocks 2023 Aug 19, 2023 - 09:48 PM GMTBy: Gary_Tanashian

The gold stock correction has been in play since GDX/HUI doubled topped in April-May
Gold Stock Correction From a Seasonal View
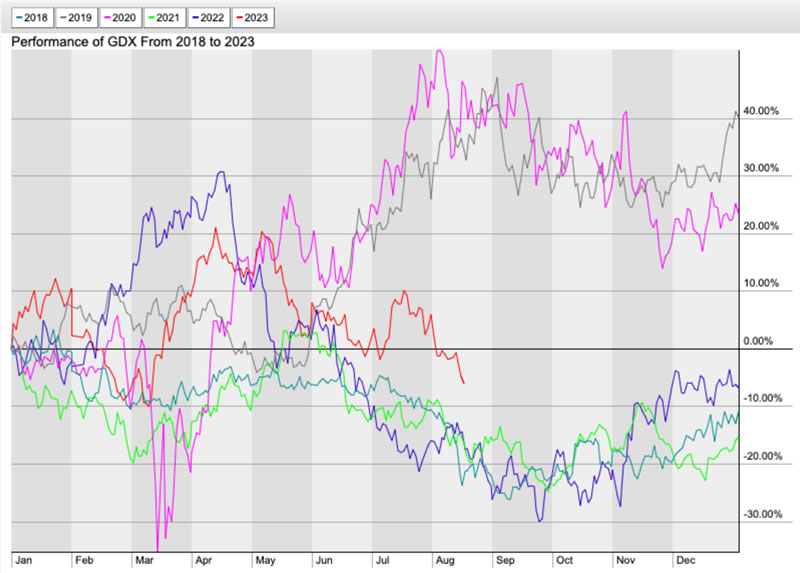
We begin this article, which updates the gold stock correction, as a platform for providing information requested by two NFTRH subscribers. Below are the recent seasonal tendencies for GDX. I’ve elected to use only the years from 2018 to current in order to keep the graph clean and to show that 2023 is shaping up per the norm in the post-pandemic era.
- Years 2019 and 2020 are actually outliers, even beyond the scope of this chart’s historical limit (2018). Pre-2018 featured trends more like the norm shown below.
- Years 2018, 2021, 2022 and thus far 2023 are more per the norm.
- If that norm plays out in 2023 (orange line) the gold stock sector will bottom in September.
Stockcharts.com
Gold Stock Correction Through the Lens of the HUI/Gold Ratio
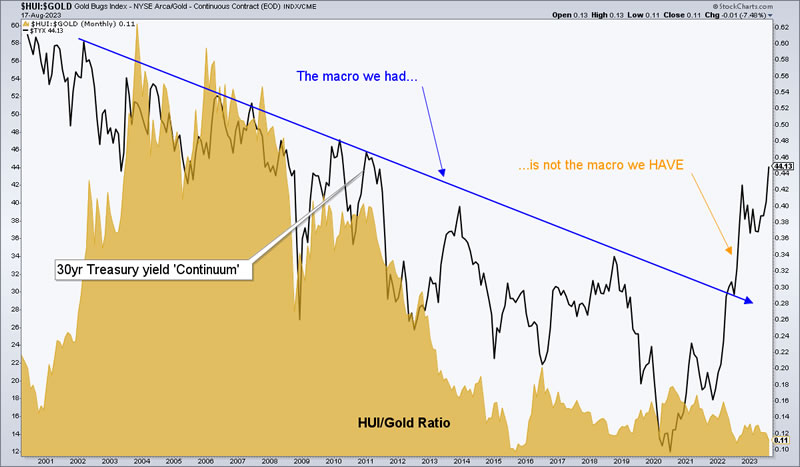
As for the other subscriber request, a GDX/GLD ratio chart going back to 2001, I’ve used the HUI/Gold ratio (HGR) which, unlike GDX/GLD, goes back that far. I’ve also added an important macro consideration to the chart, the 30yr Treasury bond yield AKA my trusty ‘Continuum’ view of the macro. This is not a be-all, end-all indicator, but it sure is a big one. Here are my thoughts on it as it relates to the HUI/Gold ratio.
- Beginning in 2003 (not coincidentally the year that gold mining fundamentals* were disregarded in favor of a gold stock bubble, circa the inflationary 2003-2008 period) the HGR has been well correlated with the decades old trend of declining long-term Treasury yields, which I have long viewed as one of the major tools by which the Fed has been able to inflate the system pretty much at will, due to the disinflationary signaling of downtrending bond yields. In other words, the Fed has played hero every time there has been an uncomfortable decline in inflation. That’s another way of saying deflation scare.
- 2022 ruptured that trend and all but destroyed this tool used as a backbone of sorts to what I’ve called the age of “Inflation onDemand“. Bye bye, inflation on demand.
- Yet despite the ruptured trend, gold stocks have continued to under-perform gold while the yield rises to a new high. This is taking me off the theme of the article, which is to update the correction. But suffice it to say, something has changed and when that change impairs central banks’ ability to inflate failing economies and markets at will I believe we will also see change in the trend of the HGR. But most gold bugs are inflation-centric, so they are probably disoriented and selling as the market works to break the inflation cycle. Patience. Much of it.
- Contrary to the views of a majority analysts (and the herds that thunder behind them) the gold sector will only be fundamentally ready after the mechanics and effects of inflation are broken for all to see. One effect of inflation is the still bubbling stock market (at least until the recent pullback that logically came amid unsustainable over-bullish sentiment). Another is the still intact economy. Each of these effects were promoted by policy makers with FULL license to inflate in 2020.
- I could and probably will one day write a discrete article on this aspect alone (after we detail and look ahead for NFTRH subscribers), as the analysis includes several other indicators that need to, and likely will, marry up to form a clear guide forward. But first we must grind out the process of change. There will be plenty of time for details of the new macro as it unfolds and delivers its guiding signals.
Stockcharts.com
* Proper gold mining fundamentals do not include cyclical inflation. Usually, it’s quite the contrary.
Gold Stock Correction, Daily Chart Technical View
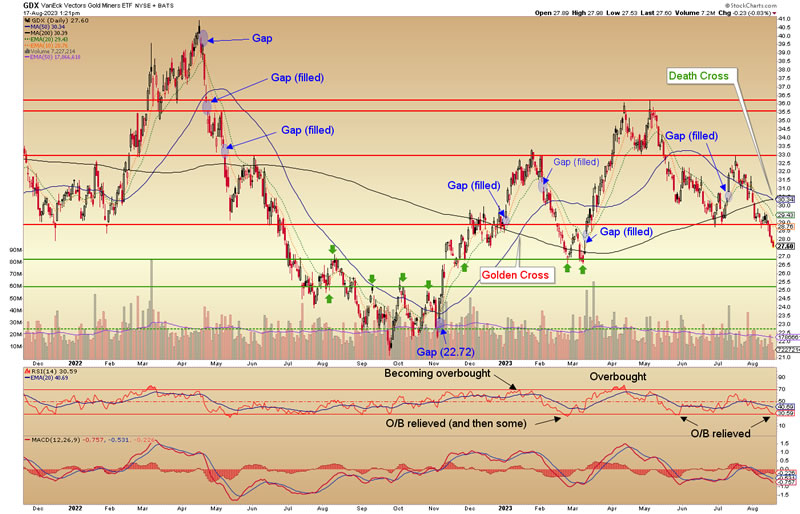
As for GDX, let’s look at the daily chart NFTRH has used in reports and updates to guide the process of rallies and corrections since Q4, 2022. With all of that history the chart is getting a little busy, but then again it’s got a lot to say.
Let’s put aside much of the chart’s previous history and take the situation from the secondary (double) top in May. Our weekly updates on the status have allowed us (subscribers and myself) the opportunity to be fully prepared for what is unfolding now.
- For humorous reasons I’ve noted “Death Cross” as the SMA 50 ticks below the SMA 200. Just as I noted “Golden Cross” back in January as a warning about an oncoming correction that followed shortly thereafter. To review, anyone touting these TA novelties should be disregarded, at least until they learn better and stop promoting such nonsense (the MSM never learns better, as Golden and Death crosses are major media eyeball harvesters aimed at less experienced investors). I painted the current Death Cross green because if the outcome that follows most often does again, there would eventually be a strong move upward coming.
- Our long held target of filling the sub-28 gap was registered on Wednesday. Thursday sees the move down continuing. As long as GDX holds a higher low to the March low, it is capable of reasserting its uptrend.
- Fail that higher low and we’ll be operating to the lower target, which is to fill the 22.72 gap per a measurement of what could be a Head & Shoulders top. I have not delineated it, but you can probably see it with the uptrending SMA 200 (black line) acting roughly as its neckline. The pattern was first identified in this now public NFTRH+ update on August 3. It began as something of a novelty. Now? Not so much.
- Bottom Technical Line: Hold a higher low to March and the uptrend remains intact. Lose it and GDX is probably (short of a bear trap false breakdown) on the ‘22.72 Gap Fill Express’. In that case today’s oversold RSI reading could be replaced by an extreme one amid a table pounding opportunity to go contrary. But considering the moderate degree it is currently oversold and the humorous “Death Cross” novelty to boot, a rally from above the March low is not out of the question either. The market, not you or I and our bias, will decide.
Stockcharts.com
Anecdotally I see would-be contrarians stepping up to buy gold stocks. Being brave when others are fearful. That is fine, but some of the suspects I see talking (writing, tweeting, etc.) are people I’ve noticed to be usually/always bullish contrary indicators in the past. Combining this with the tendency for gold stock corrections to end with much drama, I would not be so sure that the support associated with that March low will hold.
But it’s up to the market, not me. I am just a guy holding a few preferred gold stocks with a hedge in place. Give me a hold of the March low or give me, not death, as it may feel like for those fully positioned, but give me that lower gap fill. If the gold stock correction halts at/above the March low I’ll release the hedge. If not, I’ll try to hold it into a dramatic low, while likely adding to preferred positions and adding a couple others I have a greedy eye on.
None of this will be useful for more than a trade if the macro fundamentals do not improve. But I expect those funda, battered but not beaten over the last few months, to do exactly that.
[edit] Short position covered, along with those against SPX, NDX and SOX. This was based on gut, not charts. “Don’t be greedy” they say. So I wasn’t. Bounces are a thing, after all.
For “best of breed” top down analysis of all major markets, subscribe to NFTRH Premium, which includes an in-depth weekly market report, detailed interim market updates and NFTRH+ dynamic updates and chart/trade setup ideas. You can also keep up to date with actionable public content at NFTRH.com by using the email form on the right sidebar. Follow via Twitter ;@NFTRHgt.
By Gary Tanashian
© 2023 Copyright Gary Tanashian - All Rights Reserved
Disclaimer: The above is a matter of opinion provided for general information purposes only and is not intended as investment advice. Information and analysis above are derived from sources and utilising methods believed to be reliable, but we cannot accept responsibility for any losses you may incur as a result of this analysis. Individuals should consult with their personal financial advisors.
Gary Tanashian Archive |
© 2005-2022 http://www.MarketOracle.co.uk - The Market Oracle is a FREE Daily Financial Markets Analysis & Forecasting online publication.