


Weekly Stock Market Technical Analysis Report - 7th April 07
Stock-Markets / US Stock Markets Apr 07, 2007 - 11:49 AM GMTBy: Mike_Burk

The good news is: After a little rest this week the market is likely to move up sharply.
Short Term
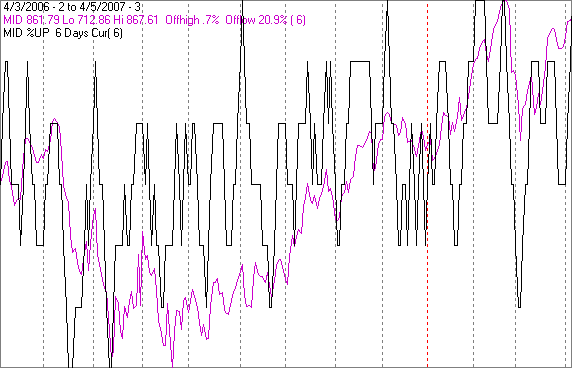
The S&P mid cap index (MID) has been the champ at putting together unbroken strings of consecutive up days.
The first chart shows the MID in magenta with an indicator showing the percentage of the previous 6 trading days that were up. The indicator touches the top of the chart when there have been 6 or more consecutive up days and it touches the bottom of the chart when there have been 6 or more consecutive down days. It is a little difficult to see, but, as of Thursday's close, the indicator is at the top of the chart.
The chart covers the past year with dashed vertical lines drawn on the 1st trading day of each month.
After the indicator has touched the top of the screen prices have experienced a brief decline.
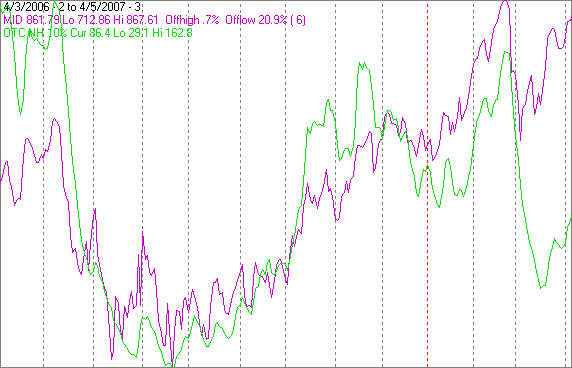
The next chart covers the same period with the same index. The indicator (OTC NH) is a 10% trend (19 day EMA) of NASDAQ new highs.
The indicator has been near a cycle high every time the indicator in the previous chart touched the top of the chart, except this time.
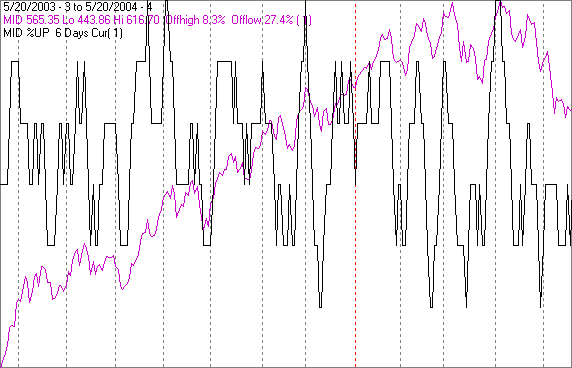
In the following charts are similar to those above except they cover the year from May 20, 2003 to May 20, 2004.
After a long upward run the index hit a new high in early April culminating with a run of 8 consecutive up days which turned out to be the high for the next 6 months.
There are similarities in the patterns of OTC NH.
It is encouraging to see the peak in OTC NH came in January 2004 while the indicator was near its high when the index peaked in late February this year.
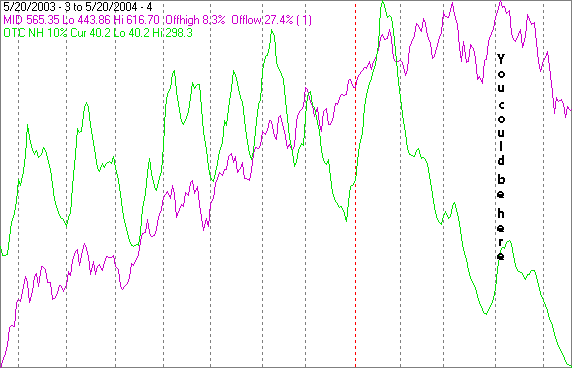
2004 was the 4th year of the Presidential Cycle and this year is the 3rd and the average patterns for those two years are decidedly different. However, the last half of last year was unusual for the 2nd year.
Usually long strings of consecutive up days are a positive indicating a strong market. However, sometimes they are a blow off.
Intermediate term
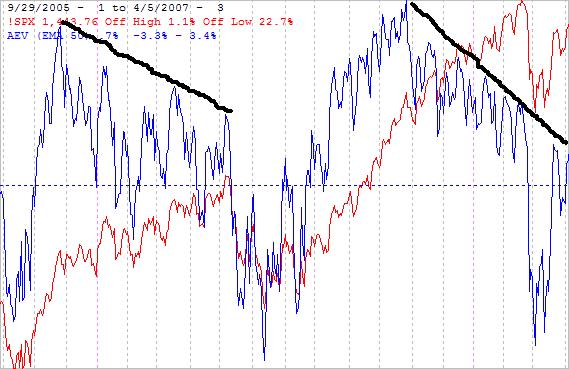
The chart below covers the past 1.5 years showing the S&P 500 (SPX) in red and an indicator showing the mean percentage the component issues of the SPX are above or below their respective 50 day EMA's (AEV) in blue.
The chart suggests we are at a critical point, if the indicator is turned down at the trend line it will take the index down with it.
Seasonality
Next week is the week prior to the 2nd Friday in April during the 3rd year of the Presidential Cycle.
The tables show the NASDAQ composite (OTC) from 1963 - 2003 during the 3rd year of the Presidential Cycle and SPX data beginning with 1955. SPX data prior to 1953 has been omitted because the market traded 6 days a week.
There are summaries for both the 3rd year of the Presidential Cycle and all years combined.
On average, April has been one of the strongest months of the year, however, next week has been the weakest week of the month with modestly positive returns.
Report for the week prior to the 2nd Friday of April
The number following the year it's position in the presidential cycle.
Daily returns from Monday to 2nd Friday.
| OTC Presidential Year 3 | ||||||
| Year | Mon | Tue | Wed | Thur | Fri | Totals |
| 1963-3 | 0.43% | -0.34% | 0.03% | -0.28% | 0.25% | 0.09% |
| 1967-3 | -0.74% | -1.20% | 0.29% | 0.57% | 0.30% | -0.78% |
| 1971-3 | 0.45% | -0.02% | 0.21% | 0.56% | 0.25% | 1.45% |
| 1975-3 | -0.52% | 0.26% | 1.17% | 0.48% | 0.73% | 2.10% |
| 1979-3 | -0.79% | -0.17% | 0.49% | 0.20% | 0.37% | 0.10% |
| 1983-3 | 1.01% | 0.71% | 1.17% | 1.04% | 1.00% | 4.94% |
| Avg | -0.12% | -0.08% | 0.67% | 0.57% | 0.53% | 1.56% |
| 1987-3 | 0.10% | -0.86% | 0.21% | -0.67% | -0.25% | -1.47% |
| 1991-3 | -0.03% | -0.64% | -0.35% | 1.74% | 0.46% | 1.19% |
| 1995-3 | -0.22% | -0.61% | -1.11% | 0.30% | 0.54% | -1.10% |
| 1999-3 | 0.22% | -0.59% | -2.00% | 0.59% | -1.51% | -3.29% |
| 2003-3 | 0.43% | -0.47% | -1.89% | 0.65% | -0.50% | -1.77% |
| Avg | 0.10% | -0.64% | -1.03% | 0.52% | -0.25% | -1.29% |
| OTC summary for Presidential Year 3 1963 - 2003 | ||||||
| Avg | 0.03% | -0.36% | -0.16% | 0.47% | 0.15% | 0.13% |
| Win% | 55% | 18% | 64% | 82% | 73% | 55% |
| OTC summary for all years 1963 - 2006 | ||||||
| Avg | 0.09% | 0.00% | -0.11% | 0.11% | -0.03% | 0.06% |
| Win% | 61% | 55% | 55% | 57% | 57% | 64% |
| SPX Presidential Year 3 | ||||||
| Year | Mon | Tue | Wed | Thur | Fri | Totals |
| 1955-3 | 0.27% | 0.59% | 0.13% | 0.21% | 0.45% | 1.65% |
| 1959-3 | 0.28% | -0.21% | -0.48% | -0.07% | 0.09% | -0.39% |
| 1963-3 | 0.47% | 0.07% | -0.32% | -0.04% | 0.49% | 0.67% |
| 1967-3 | -1.25% | 0.73% | -0.11% | 0.77% | 1.08% | 1.21% |
| 1971-3 | 0.76% | 0.10% | 0.38% | 0.15% | -0.03% | 1.36% |
| 1975-3 | -0.66% | 0.80% | 2.00% | 1.12% | 0.49% | 3.75% |
| 1979-3 | -0.86% | 0.12% | 0.45% | -0.41% | -0.05% | -0.75% |
| 1983-3 | 1.50% | 0.44% | 0.61% | 0.85% | 0.40% | 3.81% |
| Avg | -0.10% | 0.44% | 0.67% | 0.50% | 0.38% | 1.87% |
| 1987-3 | 0.51% | -1.74% | 0.19% | -1.48% | -0.13% | -2.64% |
| 1991-3 | 0.88% | -1.35% | -0.11% | 1.20% | 0.73% | 1.36% |
| 1995-3 | -0.61% | -0.15% | -0.09% | 0.07% | 0.63% | -0.14% |
| 1999-3 | 0.76% | -0.65% | -1.58% | -0.42% | -0.29% | -2.19% |
| 2003-3 | 0.12% | -0.19% | -1.40% | 0.65% | -0.38% | -1.19% |
| Avg | 0.33% | -0.81% | -0.60% | 0.00% | 0.11% | -0.96% |
| SPX summary for Presidential Year 3 1955 - 2003 | ||||||
| Avg | 0.17% | -0.11% | -0.02% | 0.20% | 0.27% | 0.50% |
| Win% | 69% | 54% | 46% | 62% | 62% | 54% |
| SPX summary for all years 1953 - 2006 | ||||||
| Avg | 0.14% | 0.11% | -0.02% | 0.03% | 0.04% | 0.30% |
| Win% | 58% | 56% | 54% | 54% | 54% | 57% |
Mutual Fund
Compliance issues demand that I not mention the mutual fund that I manage by name or symbol in this letter.
To see a current chart of the fund go to: http://finance.yahoo.com/q/bc?s=APHAX&t=3m
For information about the fund go to: http://www.thealphafunds.com/index.htm . The fund now has service class shares available.
Conclusion
The market is overbought and seasonality does not offer much support.
I expect the major indices to be lower on Friday April 13 than they were on Thursday April 5.
By Mike Burke
Mike Burk is an employee and principle of Alpha Investment Management (Alpha) a registered investment advisor. Charts and figures presented herein are believed to be reliable but we cannot attest to their accuracy. The views expressed are provided for information purposes only and should not be construed in any way as investment advice. Furthermore, the opinions expressed may change without notice. To subscribe to this report : http://alphaim.net/signup.html
© 2005-2022 http://www.MarketOracle.co.uk - The Market Oracle is a FREE Daily Financial Markets Analysis & Forecasting online publication.