Fate of Stock Market Q4 Rally
Stock-Markets / Stock Market 2022 Oct 25, 2022 - 10:25 PM GMTBy: Sumeet_Manhas
S&P 500 turnaround was driven by the WSJ article that painted 75bp Nov and 50bp Dec hikes as some kind of a pivot, when it‘s not even a pause. While I had been for weeks of the opinion that this is the most likely route they‘ll take, markets have started favoring 75bp in Dec, and its possibility has been on Friday dialed back to 50% only. That‘s hardly a pause or pivot to me, but the speculation was enough to carry risk-on sentiment reliably into the close.
What I am questioning is whether sustainable bottoms can be made on such a news – even sustainable only in terms of giving rise to a reliable Q4 rally. Not when long-dated Treasuries still haven‘t found a bottom as foreigners are forced to sell in dramatic reversion of seemingly forever trade surpluses and high energy prices, which in case of natural gas can‘t be as regionally comparable as in oil. Together with the Fed balance sheet shrinking, this has implications for the debt markets, which I discussed both in mid Sep and in the above linked article.
The turn in junk bonds is fine for the bulls, but similarly to the S&P 500, it‘s still characterized by a pattern of lower highs after the summer rally fizzled out. It‘s only the Russell 2000 which has managed to keep above the Jun lows – and that confirms the rightful conclusion that the U.S. are best positioned at the moment still to weather the storm. What has become concerning on Friday though, is the dollar‘s daily session – not even sharply higher yields have worked to keep it afloat.
What was a consolidation before another upswing, risks becoming a period when the dollar starts declining, which is a recognition that the Fed and most global central banks‘ tightening strains created and manifesting, won‘t remain overseas, but would reach the States as well. While not enough cracks are emerging, both the U.S. and global leading economic indicators are projecting a picture of guaranteed recession – with the only questions being its severity and duration. Thursday‘s batch of economic data that I highlighted for you the day before, confirm that.
Also the earnings per share for the 500-strong index paints a bearish long-term picture – the current $245 figure would be dialed back to $190, perhaps even $180s, and that would have consequences on the valuation multiple for stocks as well. After the week just in, it can be said that the percentage of companies beating estimates, and the magnitude of a positive surprise, is historically disappointing – quite so in financials. No matter how well MSFT and GOOG would do next week, they are to be balanced by META, with AMZN being the wildcard. Thursday‘s AAPL is arguably the best bearish catalyst out there next week, and before its time comes, we may have to deal with fake (or real) breakout attempts of the key zone mentioned right below, making it sensible to marginally adjust the stop-loss in place.
Technically for S&P 500, unless the 3,795 – 3,810 zone is broken, the bears hold the upper hand. The appearing cracks, the financial stress in the system as shown in CDS or USD swap facilities being drawn, would hold the upper hand in this headline sensitive risk-on rally that‘s trying to front run the Fed without evidence that the Fed is actually at least pausing. That would prove the (otherwise seasonally justified rally‘s) undoing, with more pain to come early 2023.
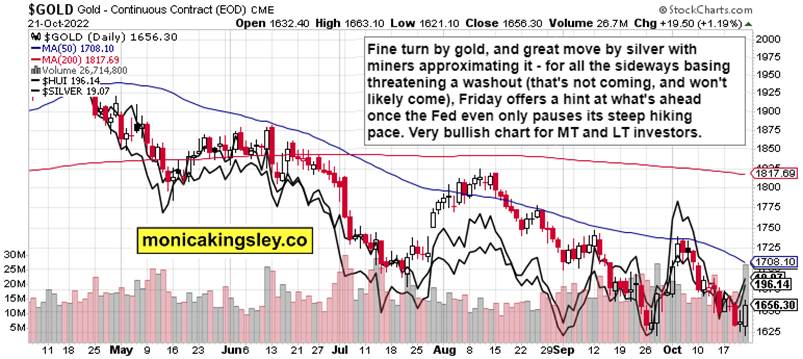
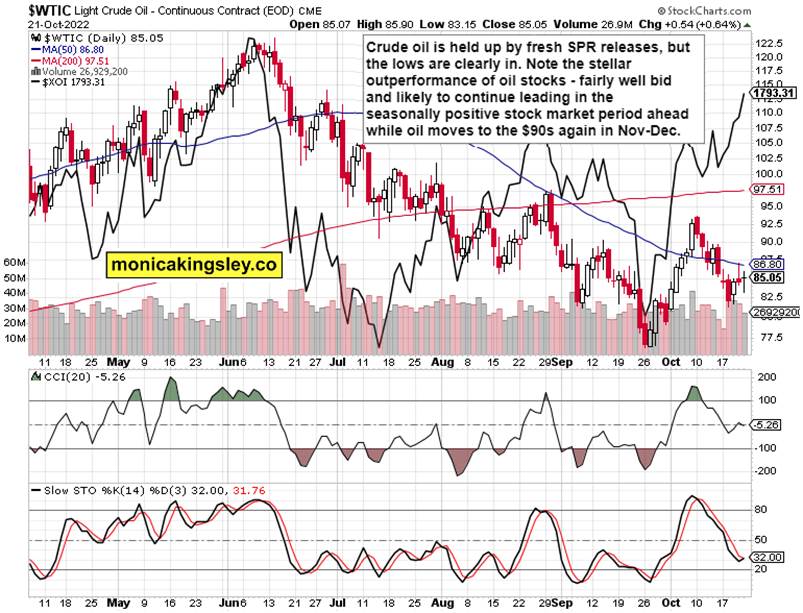
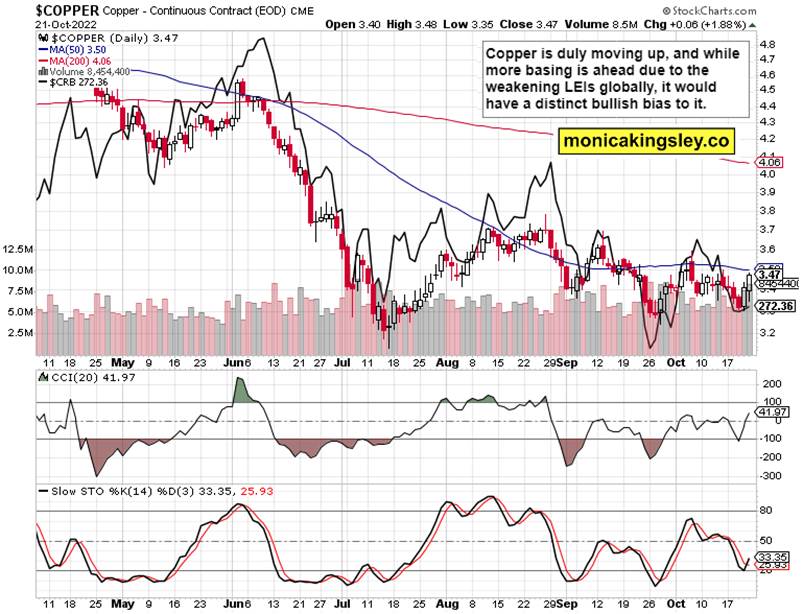
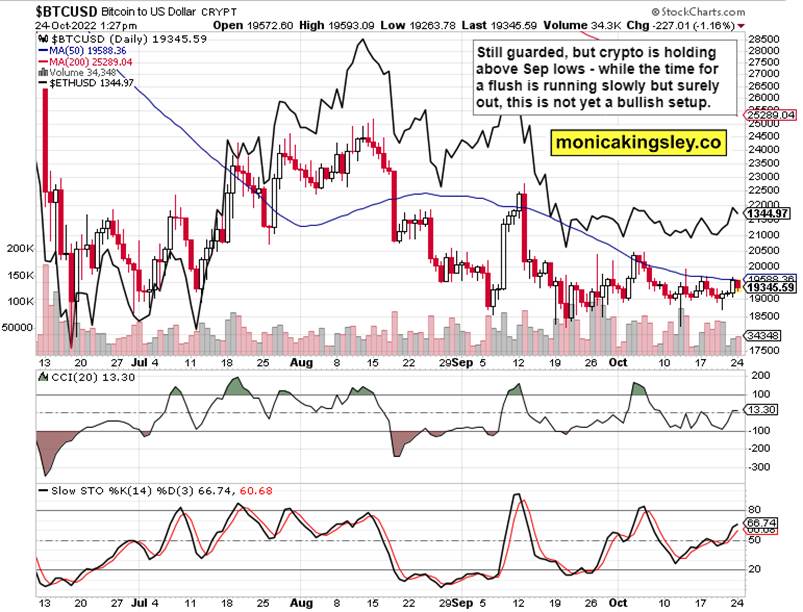
I‘m covering the impact on precious metals and commodities in the rich chart section – suffice to say that the former appear to have made quite a turn Friday while oil would keep grinding higher, and copper recovering while cryptos are to continues sideways for now. These moves are as much about the Fed and the dollar as about inflation whose core components aren‘t rolling over really.
Today‘s analysis has been one of those extensive ones – keep enjoying the lively Twitter feed serving you all already in, which comes on top of getting the key daily analytics right into your mailbox. Plenty gets addressed there, but the analyses (whether short or long format, depending on market action) over email are the bedrock, so make sure you‘re signed up for the free newsletter and that you have Twitter notifications turned on so as not to miss any tweets or replies intraday.
Let‘s move right into the charts (all courtesy of www.stockcharts.com) – today‘s full scale article features good 6 ones.
Gold, Silver and Miners

It‘s not only about the steep rise in volume, but about the miners confirming both on a daily basis and since early Sep. First it‘ll be silver, then gold with miners who would turn – we‘re close to the opening stage in the upswing, but not there yet unless the Fed nears its pause. Too early yet to talk about PMs decoupling.
Crude Oil

- Crude oil is well bid, won‘t decline more no matter what‘s going on with the SPR. Oil stocks outperformance demonstrates that beneath the surface, all is well for crude oil investors – the era of constricted supply will be increasingly more having the upper hand over the quarters and years ahead as exploration and drilling are lagging behind, not to mention geopolitics.
Copper

Copper upswing is done basing as much as precious metals are – it‘ll keep basing with an upward bias, rewarding patient investors.
Bitcoin and Ethereum

Cryptos remain on guard, but the technical posture is improving. Not yet time to jump in, but the dips are being bought, providing more than a range play opportunity to the patient ones.
Thank you for having read today‘s free analysis, which is available in full here at my homesite. There, you can subscribe to the free Monica‘s Insider Club , which features real-time trade calls and intraday updates for all the five publications: Stock Trading Signals, Gold Trading Signals, Oil Trading Signals, Copper Trading Signals and Bitcoin Trading Signals.
Thank you,
Monica Kingsley
Stock Trading Signals
Gold Trading Signals
www.monicakingsley.co
mk@monicakingsley.co
* * * * *
All essays, research and information represent analyses and opinions of Monica Kingsley that are based on available and latest data. Despite careful research and best efforts, it may prove wrong and be subject to change with or without notice. Monica Kingsley does not guarantee the accuracy or thoroughness of the data or information reported. Her content serves educational purposes and should not be relied upon as advice or construed as providing recommendations of any kind. Futures, stocks and options are financial instruments not suitable for every investor. Please be advised that you invest at your own risk. Monica Kingsley is not a Registered Securities Advisor. By reading her writings, you agree that she will not be held responsible or liable for any decisions you make. Investing, trading and speculating in financial markets may involve high risk of loss. Monica Kingsley may have a short or long position in any securities, including those mentioned in her writings, and may make additional purchases and/or sales of those securities without notice.
© 2005-2022 http://www.MarketOracle.co.uk - The Market Oracle is a FREE Daily Financial Markets Analysis & Forecasting online publication.


