Stocks Bear Market Rally End Game
Stock-Markets / Stock Market 2022 Sep 09, 2022 - 10:41 PM GMTBy: Nadeem_Walayat
Dear Reader
Mega earnings week saw the stock market soar on reporting euphoria where apparently the worse the earnings the stronger the rally in stocks such as Amazon due to the twin forces of investors piling into breakouts AND the market running short stops, which surely implies that the bear market could be OVER! After all the stock market discounts the future and so is looking beyond current BAD earnings and economic data to the blue sky's of future quarters, that coupled with US bonds rallying as the market tempered future interest rate expectations down from a peak of 4% for Mid 2023 to currently 3.25% all contributing towards the S&P closing higher at 4130.
Stock Market Reality Check
Whilst the market was in the grips of BAD earnings mania I took the opportunity to trim my holdings which is another word for light selling, where my selling only went deep for Amazon which took my percent of portfolio down from 1.6% to 1.3% though after taking account of the price jump it's back up to 1.5% of portfolio which means I will probably sell more Amazon next week/ Whilst percent exposure is irrelevant right now as I am seeking to further reduce my max exposure limit. So more selling in the pipeline for Amazon and to a lesser extent others as the stock market so far has not done anything I have not been expecting it to do with the S&P having fulfilled my minimum target of 4080 and now has entered the TREACLE resistance zone of 4080 to 4180 as my forecast graph of some months illustrates.
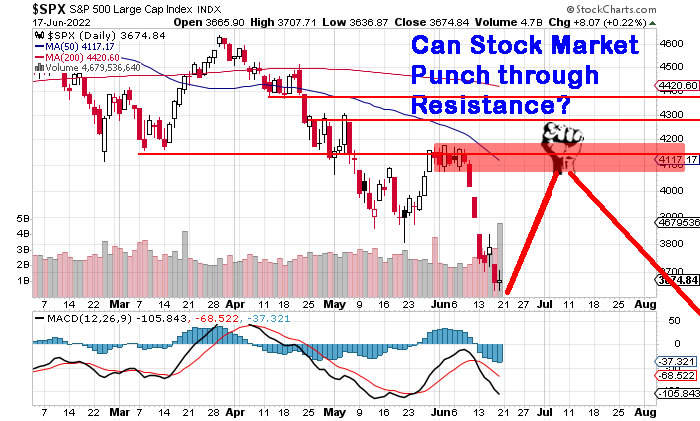
Yes, the stock market could punch through resistance but I doubt it, lemmings piling into a few already over priced tech stocks such as Apple, Amazon and Microsoft is not going to turn a bear into a bull.So whilst possible is not probable and thus my even longer range trend expectations still remain the most probable outcome in that the indices look set to print fresh bear market lows between Mid August and early September.
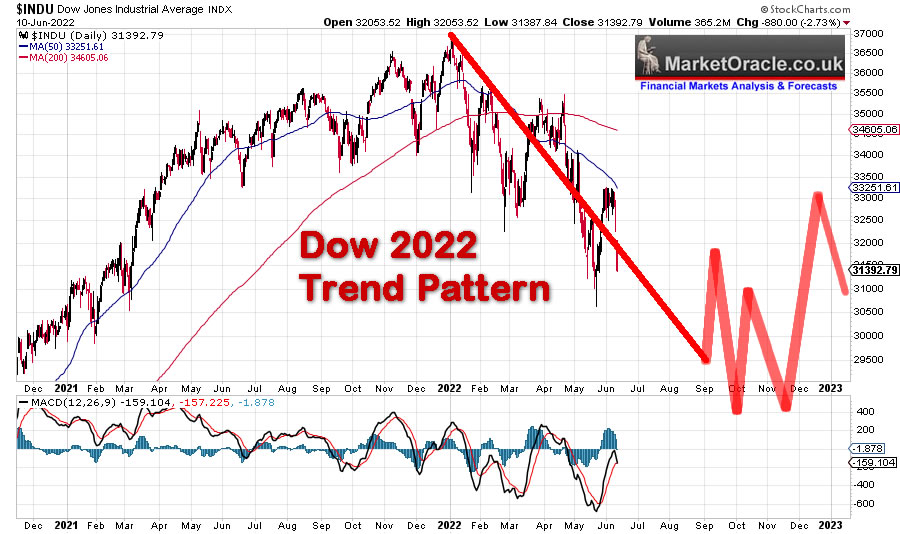
Put what the two charts together and what they are saying is that there is NO significant deviation in trend thus we remain on target for this rough pattern to unfold. In terms of fine tuning in the light of 7 weeks of additional price action since I made the trend pattern, I would expect August to end DOWN as indicated, and September to end UP this despite expectations that the whole price action from the End of August through to the End of November is expected to be very volatile, but future fog has cleared enough for an increasing probability that September will end UP for the month. So all those pinning their tails on the September CRASH Donkey will probably be amending their gobbledygook to imply they actually meant the CRASH would be in October and not September, with hindsight of course during late September when the writing will already be on the wall.
The importance of actually having a forecast graph is that it boils ALL of the analysis down onto one chart and thus stops one from getting carried away with technical analysis which is ONLY ever CLEAR with the benefit of HINDSIGHT, everything is obvious in HINDSIGHT, oh look it was clearly an Head and shoulders pattern! Yes, in HINDSIGHT! Instead what I have always relied up on are concluding TREND FORECASTS against which to measure relative STRENGTH or WEAKNESS. Which tells me a heap of a lot more about the markets than what CURRENT TA resolves to which is usually that the market could either break higher or lower. That is where most so called analysis resides with reams and reams of commentary explaining what happened, but going forward it's literally ALWAYS a COIN FLIP! Because they know if they actually put their necks on the block that it's going to get CHOPPED OFF!
So what's the mechanism for arriving at high probability trend forecasts?
It's simple, PUT ONES MONEY WHERE ONES MOUTH IS!, iF i AM WRONG I LOSE MONEY! IF I AM RIGHT I MAKE MONEY! SIMPLE! So I really do want to know that which is the most probable else I will LOSE MONEY! So I go that EXTRA MILE! Which at times can leave Patrons irritated or confused such as during February and early March 2020, where I was getting comments why the hell am I wasting so much time analysing the outbreak in China, as there have been no deaths outside of China and thus has nothing to do with the markets, we'll patrons soon found out why. To know what is going to happen one CANNOT STICK TO SCRIPTS, Methodology, rules, procedures, it won't work, one needs to have the ability to dive off the deep end into obscure tangent events, and thus those are the primary mechanisms for arriving at high probability trend forecast, being skeptical of TA, tuning into anomalous behaviour and events, perhaps in 1914 it would have been to investigate who the hell is this Archduke Franz Ferdinand and why did he get shot in Sarajevo, Or early 2016 why is this realty TV star still in the Republican race? Could the bugger actually win?
This anaysis Stocks Bear Market Rally End Game was first made available to patrons who support my work.So for immediate first access to ALL of my analysis and trend forecasts then do consider becoming a Patron by supporting my work for just $4 per month. https://www.patreon.com/Nadeem_Walayat.
Most recent analysis includes -
- Jerome Powell's TRANSITORY DIP in INFLATION, AI and High Risk Stocks Updated Buying Levels
- Answering the Question - Has the Stocks Bear Market Bottomed? Saudi Black Swan
- Stocks Bear Market Rally End Game
- Qualcom Harbinger, AI Predicts Future Stock Prices 3 Years Ahead, China Bank Runs
Bear Market Accumulation Strategy
My strategy for this bear market from the outset has been be to accumulate during a volatile trend to a probable Dow target of 29k to 30k where I settled on my best guess of 29.6k, by late August. In the course of which I was expecting volatile swings of between 15% to 30% in either direction that would allow me to BUY big during the DIPs and then SELL a portion of what I bought during the bear market rallies, as well as selective shorting. Unfortunately this bear market has tuned out to be LESS volatile than what I was expecting i.e. swings higher of 9% are just not enough for any significant trimming of positions as the table illustrates.

Then on top of that has been sterling's 15% nose dive from 1.38 to under 1.20! Which means I have not been able to capitalise on the more recent dips to the extent that I would have done if sterling had say not fallen below 1.30 which is a 10% difference in cost terms. On the flip side this makes SELLING the bear rallies easier. So even though I saw this bear coming it has not turned out to be an EASY bear market to profit form due to weak upswings.
However, the mot recent price action measured off the low of 3860 amounts to a substantial 16% move higher, finally enough to trim and to short for the next swing lower, however given that the swing has abnormally strong it also thereof raises the possibility that the stock market could have already bottomed and what we are seeing is the birth of a new bull market. Which means whilst I am continuing with my strategy of trimming and shorting the rallies, the extent to which I am entering shorts during this rally is lighter given that there is a risk I will have to take a loss on the shorts if the market HAS bottomed EARLIER than expected and fails reverse lower..
Therefore as things stand, regardless of what transpires over the coming week, my expectations remain for the bear market to continue to NEW bear market lows, it's just that stocks such as Amazon and Microsoft rallying on BAD EARNINGS, forces me to at least entertain the possibility of an early bottom, i.e. possible but not probable and even if the market has bottomed it's not going to rocket higher to new al time highs THIS YEAR! In fact July's price action acts to further confirm my trend pattern for 2022 as the in the chart above.
The bottom line is that July's strong price action is sending me a signal that the bear market does NOT have much downside left top ut, where any new low will likely only be marginally lower than the bear market low to date, with the risk that the market has already bottomed courtesy of TEN PERCENT CPLIE INFLATION! 20% REAL INFLATION!
And where the stock market is concerned given that August is about to begin does not give this rally much more upside as it tries to fight it's way higher in the TREACLE zone. It really is a tough ask to see this rally break higher and even if it did I would view it as FALSE break higher to run the stops that this bear market has delivered several times before! FALSE BREAKOUTS and BREAKDOWNS to RUN THE STOPS! So yes we could see the S&P climb to above 4180, to trade to say 4200, 4210 to give us that false signal. Furthermore stock market July strength right into the end of the month suggests that the next swing down could terminate during September rather than late August, i.e. to have enough time to complete the move.

For clarification the pink lines are not trendlines but swing projections for where the S&P could trade to.
VIX
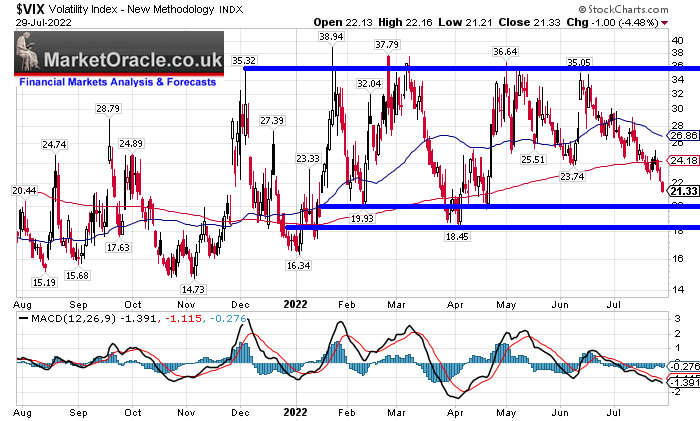
The other big bear market rally of 2022 was into the end of March bottoming at VIX 18, so current VIX of 21.3 suggests this bear market rally does not have much more upside left to it and could terminate at any point between a VIX 20 and 18.
NASDAQ
The NASDAQ is even further along this trend than the S&P having cleared resistance area of 12320 and now targeting a move into the 12550 to 13000 range, where such a move would confirm my expectations that the bottom is probably in for most AI tech stocks, i.e. it is probable that the next swing down in the Nasdaq may fail to break below 11,000 i.e. the current rally is more substantive than the March rally with lots of structure to it that will offer support on the way down..
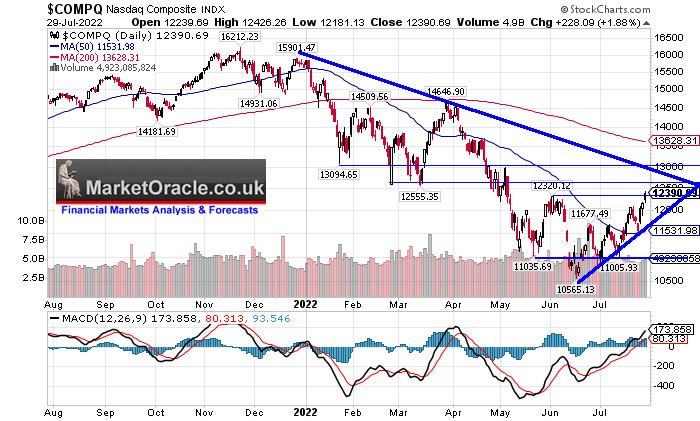
Therefore I see this rally living on borrowed time and thus I will engage in further trimming and short stocks and indices, in fact as of fridays close I already have several small shorts on Apple, Amazon and Tesla as well as shorting the S&P.just before the close which I will likely add to should the S&P go higher early week. So clearly even if bear market has now bottomed I am clearly positioning myself for a significant down swing that on tech stocks could see a typical retracement of between 50% and 60% of their rally off their June lows..
BEAR MAKRETS ARE SUPPOSED TO BE PAINFUL!
The bottom line is that bear markets are supposed to be PAINFUL! And I can tell many investors feel that PAIN from the comments as they post the latest price of say Intel or AMD or TSMC or any other stock trading lower as if I have a magic button to press to make the stock go higher. So if you are feeling PAIN then go read my earlier recent articles on the psychology of investing in bear markets because bear markets are PAINFUL where the degree of pain experienced depends on what time frame on is focused upon.
I personally have yet to begin to feel any PAIN, maybe its a function of still being 25% in cash, maybe sterling dropping by 15% has inflated my portfolio so the bear market is shallower for me, though that is a double edged sword in that it has become harder to buy stocks during recent dips. My investing mindset is a function of the sum of all of my analysis, as a test for whether my investing mindset is reliable or not, back in March 2020, as you are all probably well aware by now I plowed all of my available cash on accounts into the tech stocks during the pandemic crash event before the worst of the pandemic ever materialised And then flash forward to Mid 2021 and I proceeded to SELL my stocks portfolio all the way into their all time highs, taking my AI stocks position down from near 100% invested down to about 20%. for that is what it took to satisfy my investing mindset..
And then the bear market began with sterling riding relatively high at $1.36, and I know from experience bear markets tend to be accompanied with dollar strength, that is the BANE of investing in US stocks, for when US stocks tend to be DIRT cheap then so does STERLING! Hence why I tend to cycle in and out of US dollars to help mitigate some of this unfortunate state of affairs as for hell knows what reason ALL of the tax free accounts such as ISA'S AND SIPPs do NOT allow one to hold US Dollars, well okay there is one that does which is the II SIPP, which I plan to open whenever I see sterling trade north of 1.31.
So what is my investing mindset right now?
My investing mindset says to -
1. Get to 85% invested as soon as possible, baring in mind that right now I have to contend with sterling at GBP 1.20 so it is not easy to do so unless I see deep draw downs in prices.
2. Don't make the mistake of trimming too much on bear market rallies because they could be off the final bear market low.
3. My stocks on average will be higher a year from now then where they trader today. How high? That is very foggy without undertaking in-depth analysis but I would imagine that AI stocks on average would be at least 10% higher than where they trade today and possibly as much as 40% higher.
And that's the state of my investing mind right now. NO Pain NO Fear, just eyeing the start of the next leg down that hopefully will take me further along my goal of reaching 85% invested.
IF IN BEAR MARKET PAIN THEN INVEST AND FORGET.
HAPPY RECESSION DAY!
The US posted it's 2nd negative GDP of -0.9%, that's -2.5% down ont year, what does that mean for stocks? Corporate profits Dividend by GDP graph clearly shows that we are still near the cycle peak, i.e .unlike Q4 2019 BEFORE the pandemic crash, earnings have not contracted anywhere near to signal an earnings bottom. So this metric suggests new highs in the indices are highly unlikely THIS YEAR, especially given that GDP is FALLING. However against this we have the MAGIC of INFLATION that should support nominal stock prices as Inflation INFLATES GDP and corporate profits, case in point being the 1970's where corporate profits ROSE albeit form a 1970 trough, but the indices ended the decade little changed.
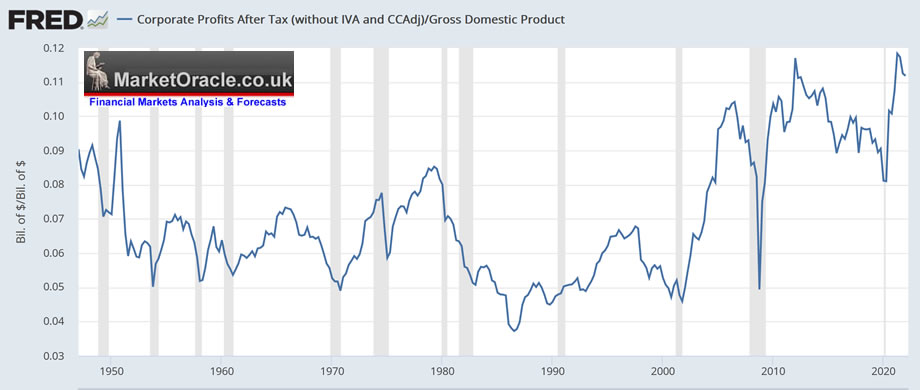
So I think corporate profits relative to GDP are going to fall, not drastically but the decline to date is not enough, we could see weak earnings for another 3 quarters which would take us into Q1 2023 as being THE earnings BOTTOM. Of course stock prices discount the future, and we have an Ace up our sleeve, EGF! Which gives near 3 months advance warning of what to expect at the next earnings for each stock, as well as the probably less reliable 1 year out EGF12M.
EGF Achieves 8 Hits out 9!
This simple to calc metric has once more managed to achieve that which wall street clowns plowing millions into their quants have failed to do right upto the point of earnings being released, against EGF that gives one a near 3 month advance warning of how the NEXT earnings could play out.
How to Calculate EGF 2.0
As a reminder the basic EGF method is by taking the current EPS, X4,. divide the stock price by it and then divide the the current PE ratio by it to result in the EGF %.
However I am always tinkering away in the background and hence have refined EGF further towards greater accuracy..
Lets take Google as an example of how to calculate following this weeks earnings
1. EPS reported $1.21 X2 = 2.42
2. EPS estimate for next quarter, where one can either use their own or pick estimate collators such as Yahoo finance. 1,26 X2 = 2.52
3. 2.42 + 2.52 = 4.94 which compares against the original method of 4.84, so should usually result in a marginal refinement.
4. Current price $116,6 / 4.92 = 23.7
5. PE ratio 21.7 / step2 result = 0.91 -1 = -8% EGF, Under original method it would be -10%
EGF -8% expects earnings to be WEAK for Q3 which should act to depress the Google stock price given that it is trading on a PE of 21.7, suggesting a possible new bear market low.
And that is how one calculates the EGF using either basic method or the refined method. Obviously I am now using the refined method in my stocks table.
AI Stocks Portfolio
The current state of my AI stocks portfolio is 75.1% invested, 24.9% cash, AI stocks 49.2% and High risk stocks 26%. Light trimming in many stocks with significant trimming limited to Amazon. Hopefully the peak is not already in and we have a few more days of upside price action ahead for further trimming.
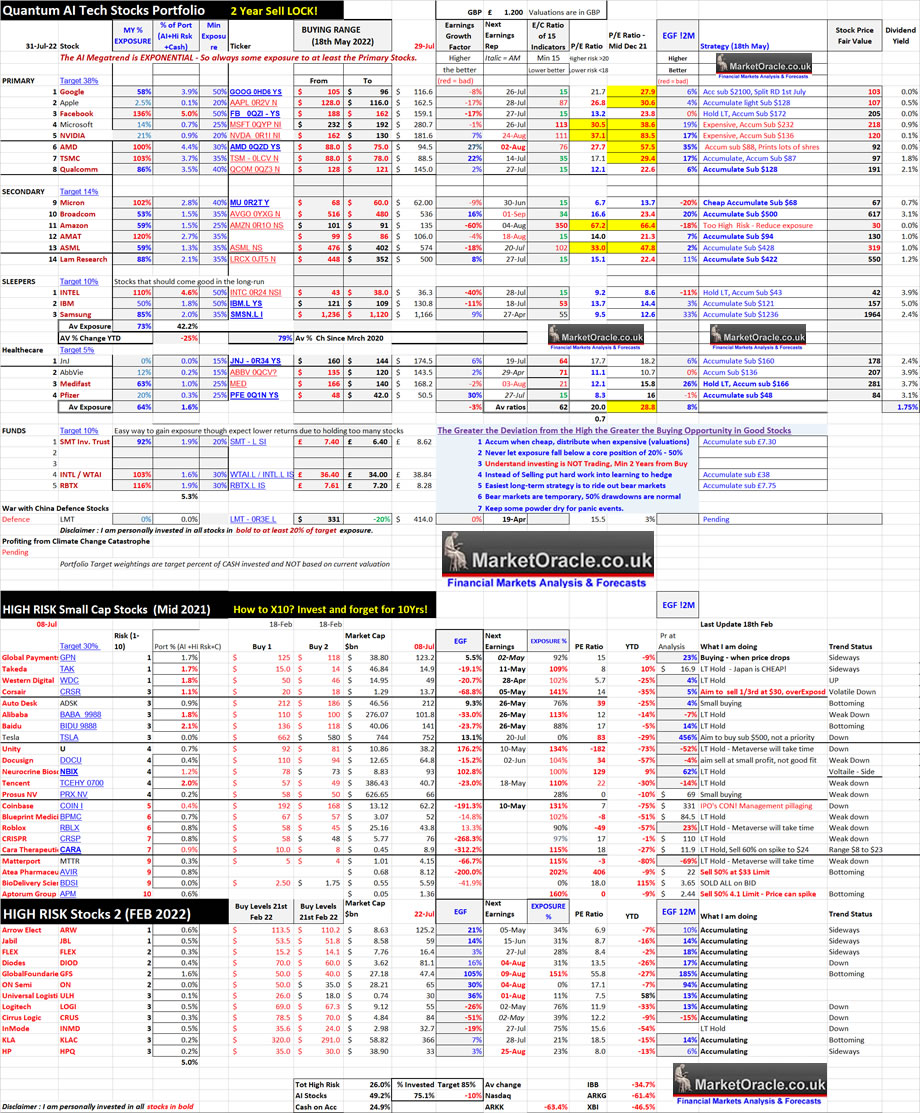
Table Big Image - https://www.marketoracle.co.uk/images/2022/Jul/Quantum-AI-Tech-Stocks-Port-31.jpg
Earnings Week
Tuesday 2nd August
AMD $94.5, EGF 27%, EGF12M 35%, PE 27.7, EC 76
High PE but very high current EGF and 12MEGF suggest to expect very strong earnings in advance of which the stock price has already soared by 30% from it's recent bear market low of $71.6. AMD traded below $80 for 2 full weeks so plenty of opportunity to get ones buying done.
An ideal trend would see AMD spike above $108 to run the stops before turning lower, which if it did so would imply a high probability that AMD has seen it's bear market bottom at $71.6.
Wednesday 3rd August
MEDIFAST $168, EGF -2%, EGF12M 26%, PE 12.1, EC 21
Medifast has been in a very shallow downtrend for the duration of this bear market. EGF is neutral, whilst PE and EC are low thus supportive. I am 63% invested an would view a sell off to below $160 to buy small, below $150 for larger buys..
This anaysis Stocks Bear Market Rally End Game was first made available to patrons who support my work.So for immediate first access to ALL of my analysis and trend forecasts then do consider becoming a Patron by supporting my work for just $4 per month. https://www.patreon.com/Nadeem_Walayat.
Most recent analysis includes -
- Jerome Powell's TRANSITORY DIP in INFLATION, AI and High Risk Stocks Updated Buying Levels
- Answering the Question - Has the Stocks Bear Market Bottomed? Saudi Black Swan
- Stocks Bear Market Rally End Game
- Qualcom Harbinger, AI Predicts Future Stock Prices 3 Years Ahead, China Bank Runs
Whilst my recent in-depth analysis is - UK House Prices Three Trend Forecast 2022 to 2025, where I pealed away every layer of the UK housing market I could think of to arrive at a high probability of trend forecast, no following of the consensus herd here! Whilst completion of my extensive analysis of the US housing market is imminent.
UK House Prices Trend Forecast 2022 to 2025
THE INFLATION MEGA-TREND
WE HAVE NO CHOICE BUT TO INVEST IN STOCKS AND HOUSING
High Inflation Forecast for Whole of this Decade Due to Rampant Money Printing
Fed Inflation Strategy Revealed
Russian Sanctions Stagflation Driver
RECESSION RISKS 2023
UK Debt Inflation Smoking Gun
Britains' Hyper Housing Market
UK Population Growth Forecast 2010 to 2030
UK House Building and Population Growth Analysis
UK Over Crowding Ratio
Overcrowding Implications for UK House Prices
UK Housing Market Affordability
UK House Prices Real Terms Sustainable Trend
UK House Prices Relative to GDP Growth
UK House Prices Momentum Forecast
UK House Prices and the Inflation Mega-trend
Lets Get Jiggy With UK INTEREST RATES
Is the US Yield Curve Inversion Broken?
UK house Prices and Yield Curve Inversions
Interest Rates How High WIll they Go?
Work From Home Inflationary BOOM?
Formulating a UK House Prices Forecast
UK House Prices 2022 to 2025 Trend Forecast Conclusion
Peering into the Mists of TIme
Risks to the Forecasts
US House Prices Trend Forecast 2022-2024
So if you want immediate access to a high probability trend forecast of UK house prices, with US and global housing markets analysis to follow soon then do consider becoming a Patron by supporting my work for just $4 per month. https://www.patreon.com/Nadeem_Walayat.
My Main Analysis Schedule
- UK House Prices Trend Forecast - Complete
- US House Prices Trend Forecast - 85%
- Stock Market Trend Forecast Into 2023.
- Global Housing / Investing Markets - 60%
- US Dollar / British Pound Trend Forecasts - 0%
- High Risk Stocks Update - Health / Biotech Focus - 0%
- How to Get Rich - 85%

- Gold and Silver Analysis - 0%
- State of the Crypto Markets
Again for immediate access to all my work do consider becoming a Patron by supporting my work for just $4 per month. https://www.patreon.com/Nadeem_Walayat.
Your eager to trim more Amazon analyst.
By Nadeem Walayat
Copyright © 2005-2022 Marketoracle.co.uk (Market Oracle Ltd). All rights reserved.
Nadeem Walayat has over 30 years experience of trading derivatives, portfolio management and analysing the financial markets, including one of few who both anticipated and Beat the 1987 Crash. Nadeem's forward looking analysis focuses on UK inflation, economy, interest rates and housing market. He is the author of five ebook's in the The Inflation Mega-Trend and Stocks Stealth Bull Market series that can be downloaded for Free.
 Nadeem is the Editor of The Market Oracle, a FREE Daily Financial Markets Analysis & Forecasting online publication that presents in-depth analysis from over 1000 experienced analysts on a range of views of the probable direction of the financial markets, thus enabling our readers to arrive at an informed opinion on future market direction. http://www.marketoracle.co.uk
Disclaimer: The above is a matter of opinion provided for general information purposes only and is not intended as investment advice. Information and analysis above are derived from sources and utilising methods believed to be reliable, but we cannot accept responsibility for any trading losses you may incur as a result of this analysis. Individuals should consult with their personal financial advisors before engaging in any trading activities.
Nadeem Walayat Archive |
© 2005-2022 http://www.MarketOracle.co.uk - The Market Oracle is a FREE Daily Financial Markets Analysis & Forecasting online publication.


