


This Usually Spells Trouble for the Stock Market (It's Happening Now)
Stock-Markets / Stock Market 2022 Apr 20, 2022 - 04:08 PM GMTBy: EWI

"Even short term, diverging trends can signal an unhealthy market"
If you've been an investor for any appreciable length of time, no doubt you've noticed that all of the stock market indexes usually move in unison.
For example, when the Dow Industrials rally, the S&P 500 and NASDAQ usually do so too -- the same applies during a broad downtrend.
As the April 8 U.S. Short Term Update, a thrice weekly Elliott Wave International publication which provides near-term forecasts for key U.S. financial markets, notes:
Think of the final days of [the big down wave] in March 2009, at the end of the Dow's 54% decline from October 2007. Nearly every stock index made a low within days of March 9, 2009 -- blue chips, technology, small caps, transports, secondary stock indexes -- and all rallied in unison thereafter.
However, when stock indexes begin to diverge, this is usually a sign that the existing trend is about to reverse.
As a case in point, let's return to that 2007-2009 bear market that was just mentioned. However, this time, let's look at its beginning.
This chart and commentary are from the Sept. 26, 2007 U.S. Short Term Update:
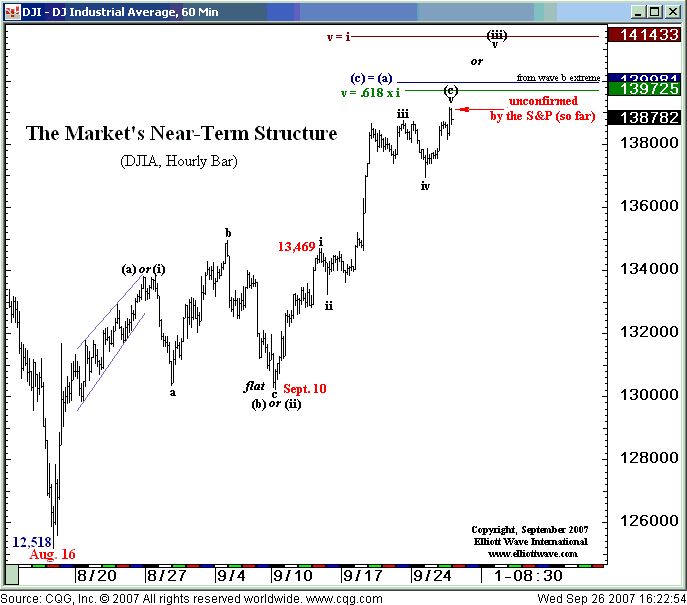
Here's the structure in the DJIA, which is the strongest of the blue-chip indexes. The pattern is similar in the S&P with the main difference being that the S&P did not push above last week's high ... leaving a short-term inter-market bearish divergence.
About two weeks after that analysis, the Dow and S&P topped -- kicking off a nearly year-and-a-half bear market.
Let's return to 2022 and additional commentary from the April 8 U.S. Short Term Update:
Even short term, diverging trends can signal an unhealthy market, depending of course on context.
Short term trends are diverging.
The very next trading (April 11), the Dow Industrials tumbled more than 400 points. And, as of this intraday writing on April 12, the Dow is down about 145 points.
As you might imagine, the Elliott wave model puts the recent, short-term diverging trends into context.
In other words, by reviewing the Elliott wave structures of the main stock indexes, you can get a good idea if those 400- and 145-point drops are part of a short-term correction or the start of a prolonged downtrend.
If you'd like to delve into the details of how to analyze financial markets using the Elliott wave model, you are encouraged to read Frost & Prechter's Elliott Wave Principle: Key to Market Behavior. Here's a quote from that book:
Every wave serves one of two functions: action or reaction. Specifically, a wave may either advance the cause of the wave of one larger degree or interrupt it. The function of a wave is determined by its relative direction. An actionary or trend wave is any wave that trends in the same direction as the wave of one larger degree of which it is a part. A reactionary or countertrend wave is any wave that trends in the direction opposite to that of the wave of one larger degree of which it is part. Actionary waves are labeled with odd numbers and letters. Reactionary waves are labeled with even numbers and letters.
Exciting news! You can read the entire online version of the book for free once you become a Club EWI member. In case you don't know, Club EWI is the world's largest Elliott wave educational community.
Don't worry about cost -- A Club EWI membership is free. More than that, members enjoy free access to an abundance of Elliott wave resources on financial markets, investing and trading -- without any obligation.
Just follow the link to get started: Elliott Wave Principle: Key to Market Behavior -- free and unlimited access now.
This article was syndicated by Elliott Wave International and was originally published under the headline This Usually Spells Trouble for the Stock Market (It's Happening Now). EWI is the world's largest market forecasting firm. Its staff of full-time analysts led by Chartered Market Technician Robert Prechter provides 24-hour-a-day market analysis to institutional and private investors around the world.
© 2005-2022 http://www.MarketOracle.co.uk - The Market Oracle is a FREE Daily Financial Markets Analysis & Forecasting online publication.