WARNING - AI STOCK MARKET CRASH / BEAR SWITCH TRIGGERED!
Stock-Markets / Stock Market 2022 Jan 19, 2022 - 06:32 PM GMTBy: Nadeem_Walayat
Dear Reader
My Stocks Bear Market / Crash Indicator (CI18) has been triggered as of Fridays close with a reading of 103.4% where a reading of at least 100% equals SWITCHED ON for the first time since late Feb 2020 when it was triggered with a reading of 112%.
Contents:
What is the CI18?
CI18 Trigger Feb 2020
Existing Stock Market Trend Forecast
Stock Market VIX
Stock Market December Trend
OMICRON THE STRAW THAT BROKE THE CAMELS BACK!
MUTED SANTA RALLY
The Alibaba Stock Market
ARKK Garbage
Stocks Bear Market of 2022 May Have Started EARLY!
Facebook $301 Buying level achieved.
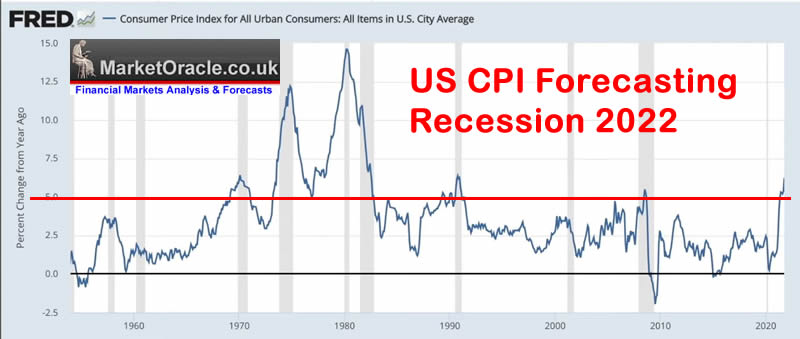
Recession 2022
Quantum AI Tech Stocks Portfolio
Crypto FLASH CRASH Early Christmas Present
What is the CI18?
CI18 (Crash Indicator Version 18) is one of the neural nets that I am working on as my AI takes baby steps into understanding how to interpret the stock market. It's task is to state what is the current risk of significantly lower stock prices (Dow) ahead i.e. that could either mark the start of a bear market or a market crash within the next few weeks .However it is NOT a trading signal as the market will already have fallen somewhat by the time it is triggered as was the case in late Feb 2020 when I had already become increasingly bearish on the prospects for the stock Market during the preceding month before the CI18 signal was triggered.
The CI18 is an independant indicator that acts as a warning to take a more detailed look at the downside prospects for the stock market, to skew ones analysis in that direction, to increase the probability for greater downside price action i.e. chart supports that I may previously have thought should hold any decline will now likely break and thus target even lower prices, how low that needs to be determined through in-depth analysis. In terms of investing and trading for me it means to seek to SELL (if I have not already sold), HEDGE and SHORT stocks and indices. Where my preferred hedging tool tends to be to short stock index futures so as to capitalise on any drop delivering fresh funds to buy more AI stocks at deep discounts just as I did during March 2020.
So CI18 it is not a SELL signal rather acts as weighting tool that tips the scales further towards a more bearish slant.
Note: This analysis was first made available to patrons who support my work:
STOCK MARKET CRASH / BEAR INDICATOR TRIGGERED - 103.4% vs 100% = Switched ON!
So for immediate first access to ALL of my analysis and trend forecasts then do consider becoming a Patron by supporting my work for just $4 per month. https://www.patreon.com/Nadeem_Walayat.
Including access to my latest compressive analysis on how to successfully invest in stocks during 2022 and beyond.
HOW TO SUCCESSFULLY INVEST IN STOCKS During 2022 and Beyond
CONTENTS:
1. UNDERSTAND WHAT INVESTING IS
2. INVEST IN GOOD COMPANIES
3. UNDERSTAND THAT WHICH ONE IS INVESTING IN
4. STOCK PRICES
5. EARNINGS CATCHUP TRADING RANGE TREND PATTERN
6. EMOTIONAL INVESTING
7. MONITORING AND LIMITING EXPOSURE IS MOST IMPORTANT
8. BUY AND SELL on the Basis of VALUATIONS
9. INVESTORS BIGGEST MISTAKE
10. BEST TIME TO BUY STOCKS
11. WORST TIME TO BUY STOCKS
12. BUY VOLATILITY
13. INVESTING TIME
14. FUND MANAGERS
15. OPTIONS
16 . INFLATION
17. INVEST AND FOREGET
AI Tech Stocks Draw down and End of Year 2022 Price Targets
CATHY WOOD ARK GARBAGE
Also access to my recent analysis that updates the current status of my High Risk Bio and Tech Stocks portfolio.
High Risk Bio and Tech Stocks Portfolio Q4 2021 Update
Contents:
Exponential AI Mega-trend
INVESTING PRIORITY
Why Most Investors LOST Money by Investing in ARK FUNDS
ETF BUBBLE Primed to EXPLODE!
INVEST AND FORGET
BREWING FINANCIAL CRISIS 2.0 - RECESSION 2022
FED TAPER CON TRICK
CP LIE - INFLATION vs DEFLATION
UK Inflation Fraud - Real Inflation is 15%+
The 2% Inflation SCAM, Millions of Workers take the Red Pill
Why Inflation is Soaring
Flip Side High Inflation Winners
Warren Buffetts $130 billion Master Plan
STOCK MARKET CRASH INDICATOR
The Quantum Entangled Stock Market
Unloved Biotech Sector
High Risk Stocks Portfolio
COINBASE $247, Risk 1, P/E 19, +0%
TAKEDA $13.7 - Risk 1, PE 10, -19%
Western Digital $56.7, Risk 2, PE 13, -2%
ABBV $132, Risk 2, PE Ratio 11, 4% Dividend, +24%
CORSAIR $21.7 - Risk 3, PE 11, -26%
Neurocrine Bioscience (NBIX) $84, PE 18, Risk 3
ALI BLAH BLAH BABA (9988) $120, PE 17.2, Risk 3
TENCENT TCEHY (0700) $57, PE 19, Risk 4, -9%
RBLX $95. Risk 6, +7%
CRISPR $74, PE 15.3, RIsk 6, -39%
AVIR P/E 30.5 , Risk 9, -71%
APM $1.88, -37%
ACCUMULATING
AI Stocks Portfolio
Limit Orders
Best Stock Investing Platforms
CRYPTO BRIEF
OMICRON a Fuss About NOTHING
So for immediate first access to ALL of my analysis and trend forecasts then do consider becoming a Patron by supporting my work for just $4 per month. https://www.patreon.com/Nadeem_Walayat.
Note: The information provided in this article is solely to enable you to make your own investment decisions and does not constitute a personal investment recommendation or personalised advice.
CI18 Trigger Feb 2020
As a reminder of the last time the trigger occurred in late February 2020 I had already been bearish on the prospects for stocks since early February in large part due to my interpretation of the risks that the virus posed that most in West largely remained blind to given that there were no cases and China was suppressing information on the virus. Even the criminals at the WHO painted a benign picture by repeatedly requesting that flights out of China continue so that travelers can continue to spew viral particles across the world which means the WHO get to have their moment in the sun, and which the mainstream media wholeheartedly regurgitated because it was CONTRARY to President Trump's halt on all flights form China stance, this despite China halting all internal flights to try and prevent spread of the Wuhan bio lab leak virus.
Still I was already bearish whilst the Dow was making new all time highs in early February with my expectations then for a 10% drop in the Dow into early to Mid March 2020.
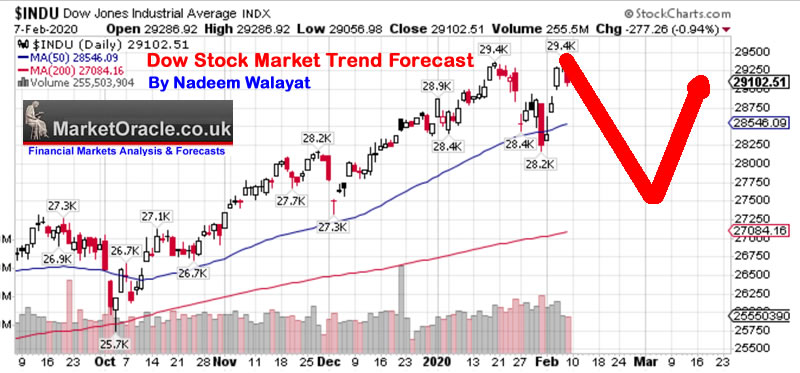
Where once the CI18 was triggered late February further contributed towards skewing my bearish expectations lower still (27th Feb 2020 The Coronavirus Stocks Bear Market Begins, When Will it End?)
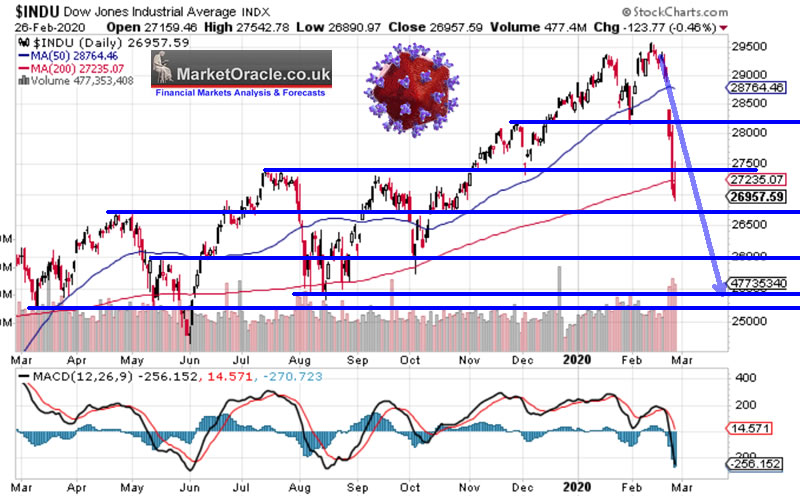
Which set us up for the mother of all buying opportunities reaching it's apex in Mid March as my analysis at the time illustrated, where nearly every AI tech stock had breached it's buying levels by some degree. Looking back today one can only fantasise of once more having such an opportunity to buy the likes of Google at $1073, and Microsoft $135, AMD at $38, Facebook $146 and Amazon at $1689 where at the time I and many Patrons dived into a stocks feeding frenzy, like Piranhas devouring cheap AI tech stocks, expending all available cash on stocks trading at levels well below what I considered as being cheap. Though it was only a few weeks later when many Patrons started asking me if they should SELL to cash in their profits following gains of 30% to 40% which at the time I warned would be a BIG MISTAKE. Instead it would be well over a year later when I would personally cash in most of my gains, though with the benefit of hindsight a few Patrons have since complained that they followed my lead and sold out so missed the likes of Nvidia's moon shot and Apple and Microsoft's continuing trends higher, that is the way of life and the markets where hindsight is always wonderful, though for some strange reason the brokers never let one buy and sell stocks with the benefit of hindsight.

And this is why I tend to hold a large amount of cash on my investing accounts so that I already have the limit orders in place to catch the falling knives rather than trying to juggle lots of plates at the same time during fast moving market panic events.
So could we be in for a similar fire sale where once more most of the buying levels are breached by a significant margin? Say Google falling all the way down to $2400, Apple to $120,Amazon $2600, Facebook at $262, and Microsoft similarly down to $262?
Existing Stock Market Trend Forecast
My last in depth analysis of the stock market in Mid September covering the period into Mid 2022 expected the Dow to target a new all time high of at least $37k during late December / Early January followed by an early year correction that could resolve in weak bull run into late April / Early May 2022.
Stock Market FOMO Hits September Brick Wall - Dow Trend Forecast Sept 2021 to May 2022
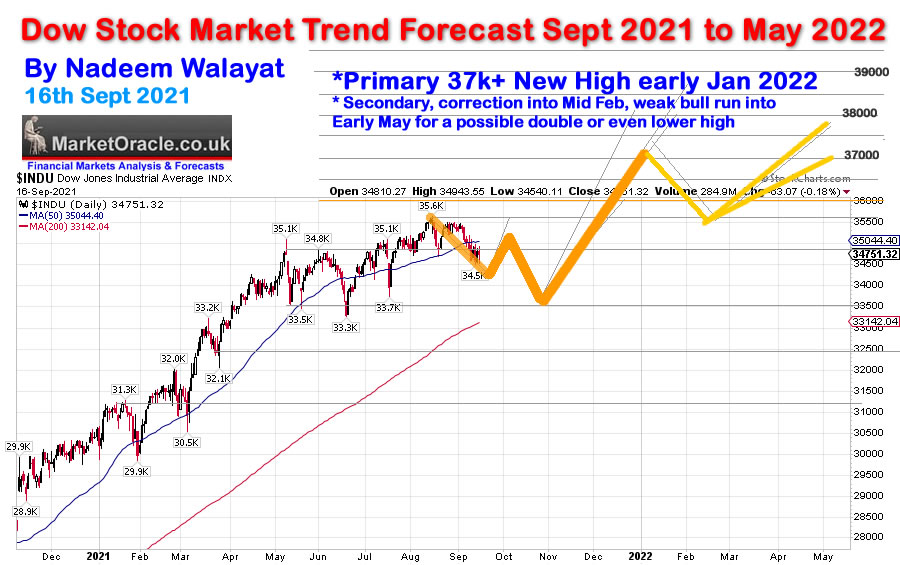
However, since I have increasingly become more bearish on the prospects for the stock market where even before the CI18 trigger I was raising the prospects that Santa could even fail to make an appearance this year as I illustrated in my last analysis focused on the Metaverse.
There are SO MANY FLASHING RED lights on my Chernobyl style stock market instrument panel where for me a few more percent of upside does not justify the growing downside risks especially in the over valued stocks.
I won't go over what I have already covered at length in recent articles such as the impact of Fed Tapering that will PIUSH investors away from OVER VALUED GROWTH stocks into UNVER VALUED stocks , which has been the theme of my articles for several months, hence why I failed to follow through on my earlier plan to repopulate my AI stocks portfolio in late October with the likes of Microsoft and Apple, instead bought VALUE in largely INTEL and since I have remained focused on buying VALUE which is why the likes of Qualcom and to a lesser extent LMT have perked my interest.
Stock Market VIX
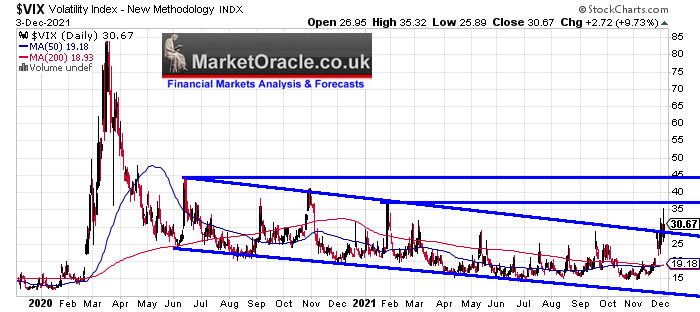
Another sign of growing negative uncertainty is the VIX spiking to above it's downtrend channel that has been in force since soon after the March 2020 pandemic panic. This implies more immediate term down side which therefore will not leave much time for a Santa to new highs.
(Charts courtesy of stockcharts.com)
Stock Market December Trend
The Dow is continuing to hold up well in terms of trend and therefore continues to suggest to expect a Sonata rally of sorts even if it gets to nowhere near breaching it's recent high of 36,600. though the time frame for my 37k target extends into early January so it is not a done deal that we won't see Dow 37k, especially given that a heap load of VALUE stocks populate the Dow Index.
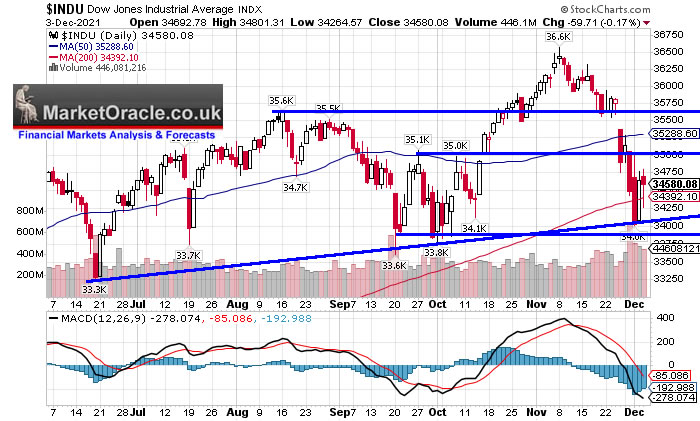
Technically not much has changed the Dow bounced off support and continues to base for a run higher probably towards between 35,600 and 36,300 set against it's last close of 34,580.
Whilst the Nasdaq suggests it could have further downside ahead to support at 14,200 which suggest another 5% to 6% of downside from the last close of 15,085. so the Nasdaq correction may only be half way done which does not leave much time for any sort of a santa rally for tech stocks.
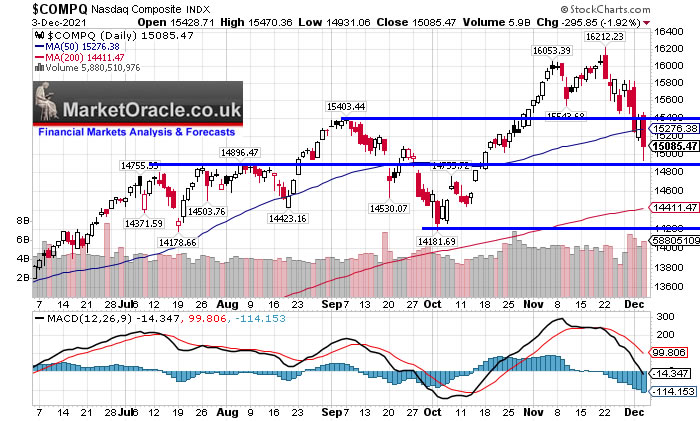
Therefore the charts are suggesting a weak santa rally for value stocks (Dow) and no santa rally for tech stocks (Nasdaq). Whilst there always remains the risk of a waterfall panic event.
OMICRON THE STRAW THAT BROKE THE CAMELS BACK!
Why is the stock market falling if most people in the West are vaccinated and many scientists are saying it's not as bad as first feared?
We'll you have an OVER VALUED OVER EXTENDED FOMO DRIVEN STOCKS RALLY that has been WAITING for a TRIGGER and then along comes the OMICRON Black Swan!
That's your STRAW that broke this stocks Bull Market CAMELS BACK!
Regardless of how bad Omicron turns out to be is irrelevant for stocks were already skating on THIN ICE where it only took someone throwing a pebble onto the ice for it to BREAK TREND!
MUTED SANTA RALLY
So whilst I still expect upwards pressure into Christmas but I would be very surprised if the indices trade to NEW ALL TIME HIGHS! Especially the likes of the Nasdaq.
The Alibaba Stock Market
Those lockdown growth tech stock darlings are leading the decline, the non FAANG variety are seriously starting to resemble Alibaba in terms of trend trajectories.,
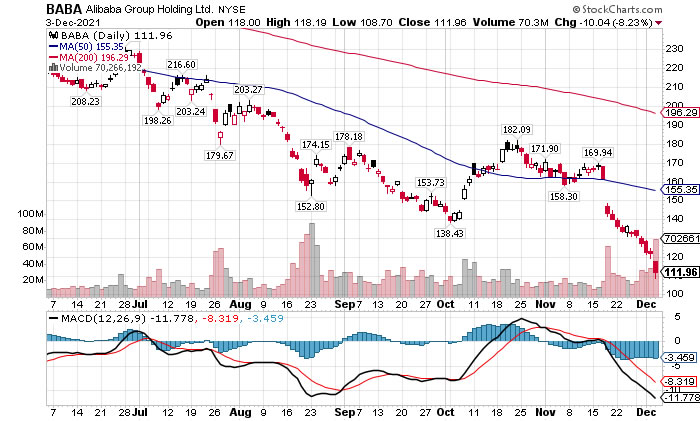
So far I have managed to dodge the buy bullet by chasing the Alibaba dragon lower in my attempts to buy the dip with daily limit orders on the HK exchange having so far failed to be filled, .for Fridays session my limit order was $115, days low was $116 so not filled. But even so here I am again with another limit order for Monday's Hong Kong session at $108.1, against Fridays HK close of $119 and US $112. So I will know by the time I post this article if I have been filled or not as I chase the Dragon down to $100? Why am I determined to buy BABA (9988)? PE ratio is now just 15.8! What's Amazon's? 66! That' why i am adding to my Alibaba for the long-run.
Whilst my update of the high risk stocks portfolio is scheduled for late December
ARKK Garbage
A warning to all the hodlers of such growth tech stocks and funds such as Cathy Woods's ARKK, the price drops may not even be half way done!
You know how much garbage is out there when analysts stop following the fundamentals and pluck metrics out of think air. For instance Price to Earnings is THE primary metric but for many stocks that populate the likes of Cathy Wood garbage funds that doe snot work, so what do they use? Price to Sales? Price to Users, Price to cotton buds in the CEO's bottom drawer!
Price to Earnings, if the stock has no earnings then well it is at the risk of going bust to tread carefully no mater what the price to sales and other such metrics imply.
Cathy Wood sales queen days ago was saying her ARKK will X4 over the next 5 years!
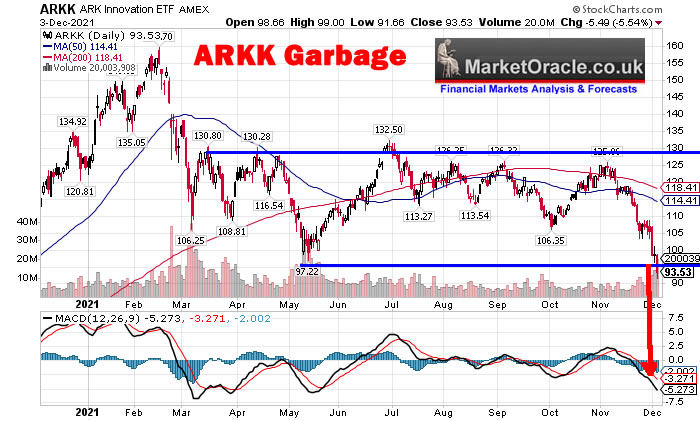
What X4 from the bottom? X4 form $10 a share to S40?
Is that what she meant because I watched the video and all she said was expects her funds to quadruple but not from what level, ARKK was trading at $105 when she spoke, today it's $93, in the not too distant future ARKK will be trading in the 70's..
Cathy wood is a SALES PERSON, not an analyst and her funds are all about generating HYPE for retail investors to FOMO into..
Stocks Bear Market of 2022 May Have Started EARLY!
So pulling all the threads together of this relatively brief update which therefore implies to expect a negative deviation against my trend forecast i.e. I expect the stock market will continue lower for a week or so before a weak santa rally that will likely fail to make new all time highs, probably putting in a lower high at round 36,000 o be followed by a deeper correction during early 2022 and a weak rally off that correction into early April and thus it is highly probable that the bear market I was expecting to begin during 2022 off a possible double top may actually have begun.as illustrated by my forecast trend chart, with my preliminary revised projection in red off the last Dow close of 34580.
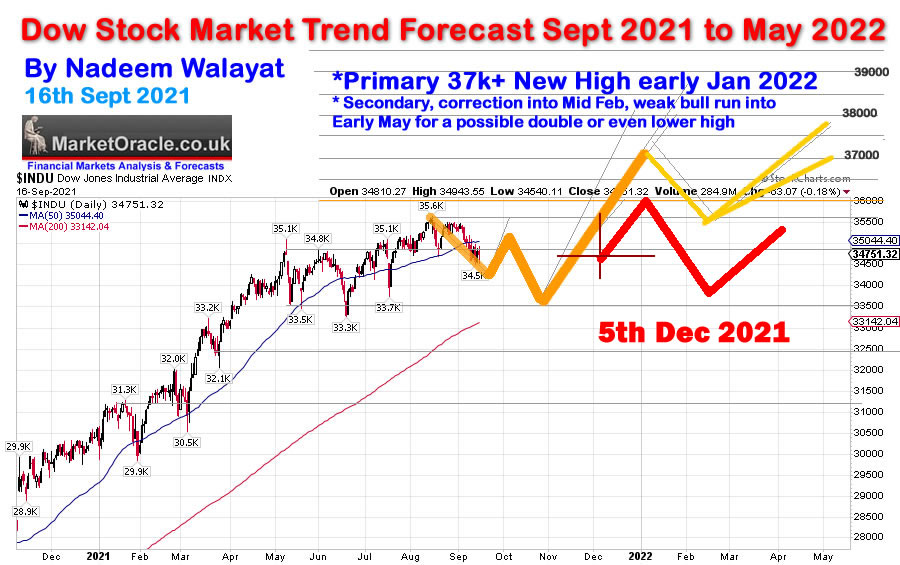
However, there is an increasing risk of a market panic event as illustrated by the CI18 Signal that are OUTSIDE the scope of technical analysis i.e. technical signals are based on technical chart levels, however panic events do not abide by technical levels instead they SLICE through them like knife through butter, so be pre-warned!. Ii would not be surprised if the Dow retraced back to the October lows of around 33,500 it's just that such a move in technical terms is not probable on the charts.
So all those who were crying recently Nadeem you made us get out early form the likes of Microsoft may in the not too distant future be congratulating themselves for their genius to have exited long before their stocks TANKED! And as for Nvidia, we'll if you are still invested in Nvidia even after the current 15% drop from it's recent high then you've not been paying attention to what I have been saying for the past few months? Where the icing on the cake would be if Cathy Wood had just turned bullish on Nvidia and had been loading up her ARKK dumpster funds with the Nvidia stock, who knows maybe she has been buying the dip?
Facebook $301 Buying level achieved.
Facebook finally delivered that which I and many Patrons have patiently been waiting for many months, that WIllie Wonka's golden ticket moment of achieving it's buying level of $301 Friday, where I actually bought a little ahead of $301 so as I could buy Facebook stock on the LSE and thus avoid current and future FX fee's, nevertheless it was all well worth the wait.
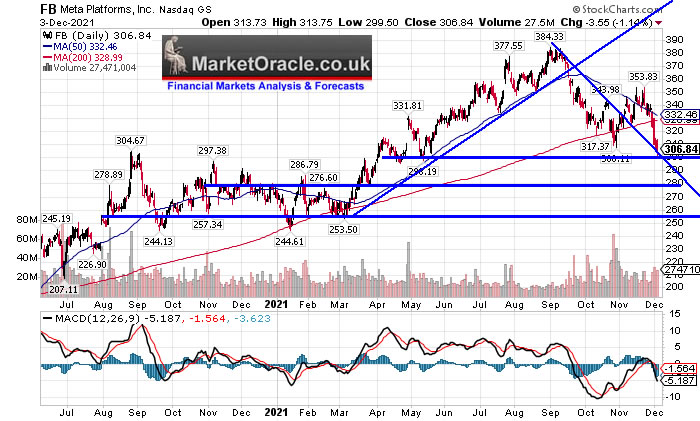
As for the future prospects for Facebook, one of the reasons why I deemed $301 as being highly probable is the fact that Facebook gas been in a downtrend since it's $390 high, and in that respect $300 changes nothing. For Facebook has yet to show any signs of making a bottom and thus I expect it to trade to below $300. In terms of how low she could blow, the stock is first targeting $280 and if that fails to halt the down trend then next follows $260. In respect of which I will be seeking to buy more Facebook stock st $282, and $262 at achievable additional buying levels to accumulate in the META-VERSES primary stock should the sell off continue.
Recession 2022
Remember what I warned in my last analysis, what CPLIE was suggesting -
Quantum AI Tech Stocks Portfolio
In terms of the AI stocks portfolio this means I am scrapping small nearby limit orders I had for Apple,. Microsoft, AVGO, and LMT, and replacing with more distant limit order, for instance I would be buying significant exposure to LMT at around $300 rather than at my just scrapped limit order of $326. Similarly I amended my LIMIT order to buy more INTEL from $47 to $44 and and IBM from $115 to $108. Though I would not be surprised if both Intel and IBM ROSE whilst the rest of the market fell, hence why I am content to already be mostly fully invested in Intel and IBM.
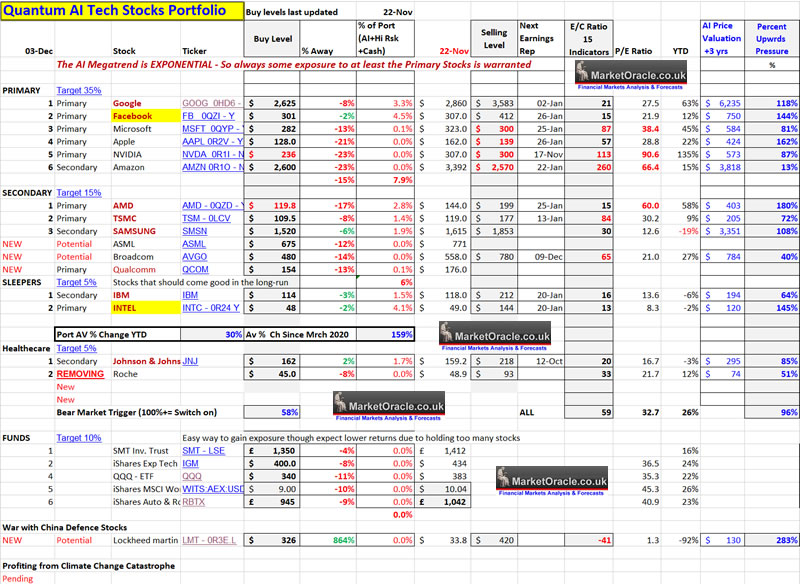
Big Image - https://www.marketoracle.co.uk/images/2021/Dec/AI-Stocks-Portfolio-4th-Dec-BIG.jpg
Also I note that SMT has taken a large tumble, which warrants investigation into why so I will seek to buy well below it's buying level of $1350, probably nearer to $1250.
Another point to mention is that earlier in the week I sold all of my Roche holdings due to lack of performance i.e the stock was only up about 16% YTD against Pfizer up about 50%. So I will be seeking to accumulate Pfizer in the future at the right price.
So apart form mission accomplished for Facebook, my future buys remain pending limit orders being achieved.
My personal focus remains on building positions in Microsoft, Apple,. Qualcom and Broadcom and to a lesser extent LMT for dividends. I am also building a small position in GPN, again all of these are on the basis of BUYING VALUE over GROWTH. As you can see there is No Amazon, Nvidia, AMD, TSMC and well I already hold Google. That's not to say I won't buy more AMD should it fall to and below it's buying level of $119.8, where my stance remains unchanged in that I WOULD buy AMD in the range of $101.8 to $119.8. So it's a case of letting the prices fall to and below my buying levels and then look at buying.
Whilst I also remain short of Nvidia and Tesla stocks. Where I aim to buy Nvidia at under $240 whilst I have no plans to buy Tesla.
So in a nut shell, the CRASH indicator has reinforced my expectations for LOWER prices during 2022 and maybe sooner for some over valued stocks and it just confirms what I have been stating for several months to FOCUS on BUYING and HOLDING VALUE over GROWTH!
Where the only mistake I appear to have made was to buy some DOCU following it's 40% crash given that it CRASHED to it's buying level of $141 and who knows going forward it may turn out to be one of the few growth stocks that bucks the trend by going up!
Crypto FLASH CRASH Early Christmas Present
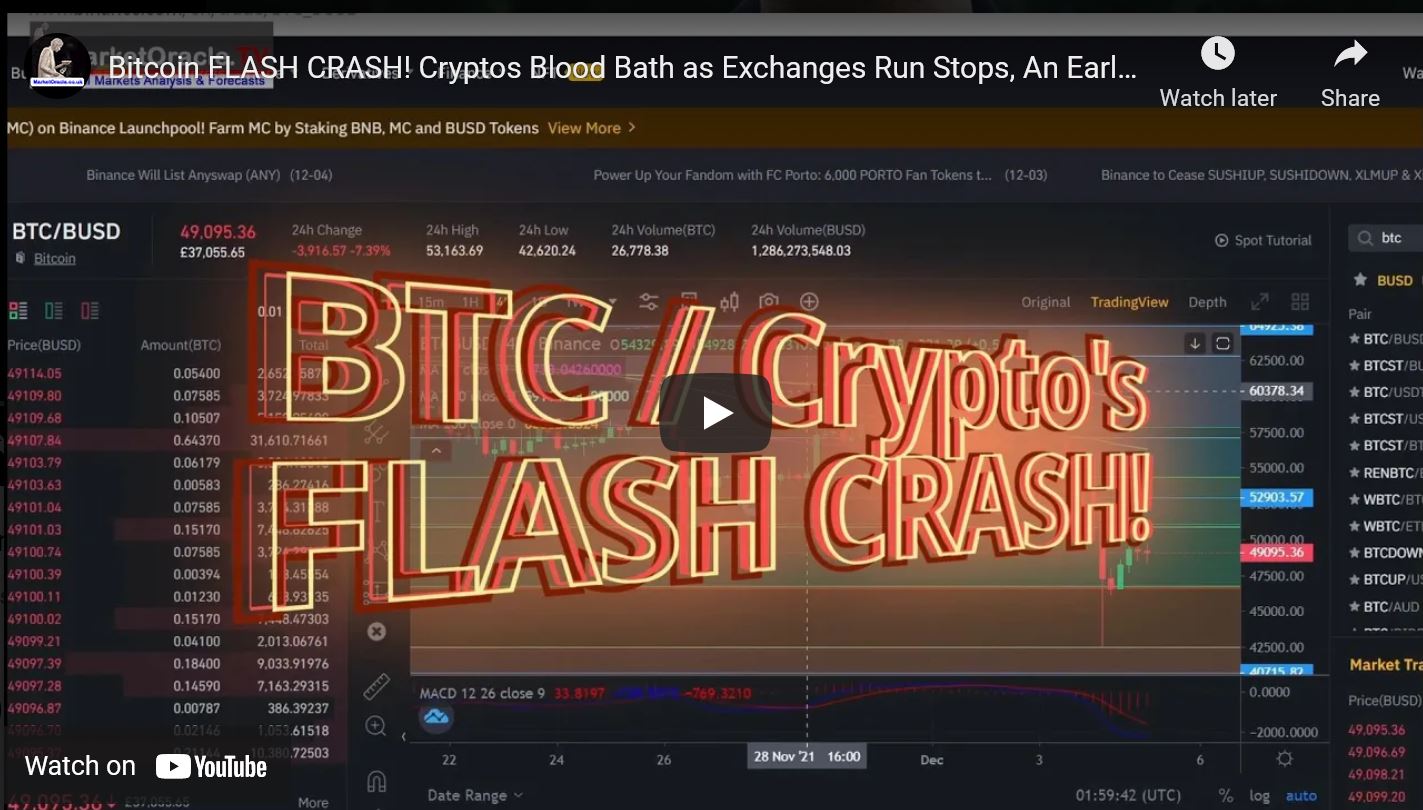
On Saturday morning I stepped away from my computer for a few hours, came back and the number of my limit orders on Binance had dropped form 75 to 30, why have most of my limit orders vanished, glancing at the bitcoin chart revealed why, a FLASH CRASH early Christmas present had taken place that took my exposure to crypto's form about 35% to 51.4% of target holdings on the Bitcoin price's spike down to just above $42k as the following video shows what happened to most of the crypto's that I am accumulating into as well as why I think the Flash Crash happened.
My next action was to repopulate with some more limit orders in the range 10% to 15% below spot Though I am just about done with accumulating crypto i.e. I have no plans to add fresh funds instead after the last of the remaining limit orders are triggered I will just let mining accrue BTC and sit back and wait for the SELL orders to be triggered on the way UP, whenever that may be. With the current overall state of my crypto portfolio at 51.5% invested of original target exposure, and currently sitting on a net loss of -6% of value of holdings vs GBP funds deposited though I imagine this percentage is going to become a lot more volatilise going forward given the expansion in the size of my crypto holdings.
A few patron's have asked what would I accumulate right now if I held NO crypto's, so if I held NO crypto's and based on the prices at the time of my posting this video (crypto prices are very volatile) then I would accumulate the following in order of preference both at spot and with limit orders at about 10%-15% below spot.
- ADA
- RVN
- Chainlink
- DOT
- BTC
- LTC
- XLM
- ETC
- VET
- EOS
- AR
- ETH
My analysis schedule includes:
- Stock Market Trend Forecast 2022
- UK House Prices Trend Analysis, including an update for the US and a quick look at Canada and China - 65% done
- How to Get Rich! - 90% done - This is a good 6 month work in progress nearing completion.
- US Dollar and British Pound analysis
- Gold Price Trend Analysis - 10%
Again for immediate access to all my work do consider becoming a Patron by supporting my work for just $4 per month. https://www.patreon.com/Nadeem_Walayat.
Your analyst warning Patrons for the nth time to BATTON DOWN THE HATCHES for the coming stock market valuation reset storm.
By Nadeem Walayat
Copyright © 2005-2022 Marketoracle.co.uk (Market Oracle Ltd). All rights reserved.
Nadeem Walayat has over 30 years experience of trading derivatives, portfolio management and analysing the financial markets, including one of few who both anticipated and Beat the 1987 Crash. Nadeem's forward looking analysis focuses on UK inflation, economy, interest rates and housing market. He is the author of five ebook's in the The Inflation Mega-Trend and Stocks Stealth Bull Market series that can be downloaded for Free.
 Nadeem is the Editor of The Market Oracle, a FREE Daily Financial Markets Analysis & Forecasting online publication that presents in-depth analysis from over 1000 experienced analysts on a range of views of the probable direction of the financial markets, thus enabling our readers to arrive at an informed opinion on future market direction. http://www.marketoracle.co.uk
Disclaimer: The above is a matter of opinion provided for general information purposes only and is not intended as investment advice. Information and analysis above are derived from sources and utilising methods believed to be reliable, but we cannot accept responsibility for any trading losses you may incur as a result of this analysis. Individuals should consult with their personal financial advisors before engaging in any trading activities.
Nadeem Walayat Archive |
© 2005-2022 http://www.MarketOracle.co.uk - The Market Oracle is a FREE Daily Financial Markets Analysis & Forecasting online publication.


