


Stock Market Short-term Trend Indicator
Stock-Markets / US Stock Markets Oct 17, 2008 - 06:33 AM GMTBy: Marty_Chenard

 Most investors look at yearly New Highs and don't look at lesser time periods. (The one year New Highs on the New York Stock Exchange has had a paltry 1 stock reading in the past few days.)
For an indication of shorter term health conditions, some analysts look at the number of 20 day New Highs and New Lows ... so that is what we will do this morning.
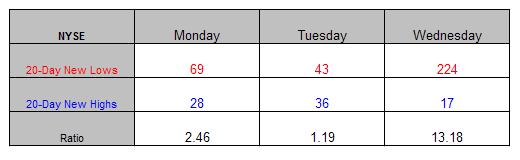
The data below shows the 20 day New Lows compared to the New Highs for this week on the NYSE. This indicator is used by short term traders and not longer term traders.
Monday through Wednesday showed that New Lows exceeded the number of New Highs on each day. The most important number is the ratio between each group.
Here are the ratios for Monday through Wednesday:
Monday: New Lows exceeded New Highs by 2.46 to 1.
Tuesday: New Lows exceeded New Highs by 1.19 to 1.
Wednesday: New Lows exceeded New Highs by 13.18 to 1.
Some short term traders/investors are thinking that stocks are cheap now and want to buy for that reason. Until the ratios start to favor the number of 20 day New Highs , downside pressure will remain in the market.
______________________________________________________________________
*** Feel free to share this page with others by using the "Send this Page to a Friend" link below.
By Marty Chenard
http://www.stocktiming.com/
Please Note: We do not issue Buy or Sell timing recommendations on these Free daily update pages . I hope you understand, that in fairness, our Buy/Sell recommendations and advanced market Models are only available to our paid subscribers on a password required basis. Membership information
Marty Chenard is the Author and Teacher of two Seminar Courses on "Advanced Technical Analysis Investing", Mr. Chenard has been investing for over 30 years. In 2001 when the NASDAQ dropped 24.5%, his personal investment performance for the year was a gain of 57.428%. He is an Advanced Stock Market Technical Analyst that has developed his own proprietary analytical tools. As a result, he was out of the market two weeks before the 1987 Crash in the most recent Bear Market he faxed his Members in March 2000 telling them all to SELL. He is an advanced technical analyst and not an investment advisor, nor a securities broker.
Marty Chenard Archive |
© 2005-2022 http://www.MarketOracle.co.uk - The Market Oracle is a FREE Daily Financial Markets Analysis & Forecasting online publication.