


Gold Price Forecast – Has the Recovery Finished?
Commodities / Gold & Silver 2019 Dec 06, 2019 - 12:40 PM GMTBy: Submissions

Gold prices pushed sharply higher on Tuesday but have stalled ever since. Has the recovery rally completed? I think it has.
Leave it to Trump to go and say something that causes the equity markets to print a two-day drop that wipes out more than a week of gains. But the tone in the markets might be changing.
The US president went from saying that the trade deal might get delayed until after the elections on Tuesday to saying that talks with China are going “very well” on Wednesday. His shift in tone carried through the markets with the S&P 500 recovering and posting on a bullish engulfing candle on a daily chart yesterday.

In a similar fashion, spot gold printed a doji candle yesterday to signal some exhaustion following the momentum-driven rally in the day prior.
Correlations between equities and gold prices are difficult to gauge this year. After all, both instruments are posting double-digit gains for the year contrary to the typical inverse correlation.
But the recent recovery in the price of gold certainly appears to be driven by safe-haven demand. Further, we are seeing the inverse correlation with equities and gold returning on the smaller time frames. This leads me to believe that the upside in gold is either close to coming to an end, or has already ended.
This viewpoint relies heavily on the fact that US equities are breaking out over the past few weeks, and as yesterday’s price action is hinting of a bullish continuation.
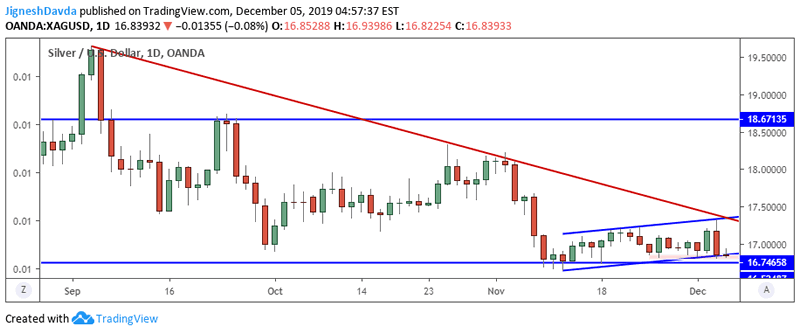
Silver Daily Chart
Beyond that, there is also a bearish signal from correlated instruments. The price of silver, for instance, fell sharply to hit a fresh two-week low yesterday. Spot silver continues to trade below its 100-day moving average and it’s hard to make a bullish technical case. Yesterday’s fall has led to a bearish engulfing candle print on a daily chart, offering a strong bearish signal. We might see a small bounce with channel support and a horizontal level within proximity, but I would expect that bulls will jump at the chance to liquidate on an uptick after yesterday’s heavy price action in silver.
Technical Outlook
Gold Daily Chart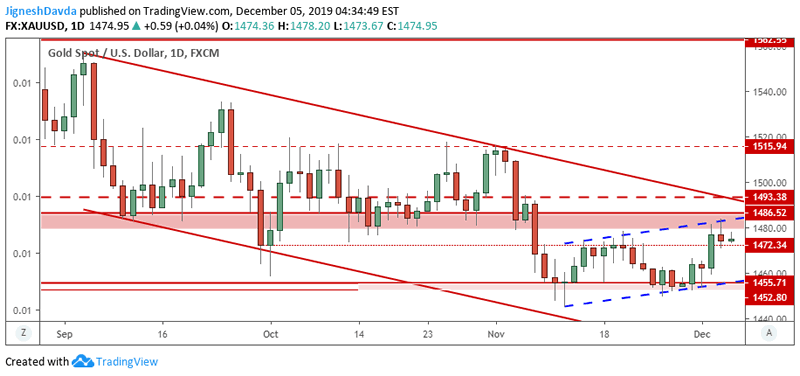
There is an area between $1480 and $1486 that previously acted as support and is now seen as resistance. Gold prices appear to have stalled out after entering this area.
But more importantly, I’m watching the upper bound of a declining trend channel that has encompassed price action since September. This is the major hurdle for gold prices, and while within this channel, there is little reason to expect a meaningful upward move.
Gold 4-Hour Chart
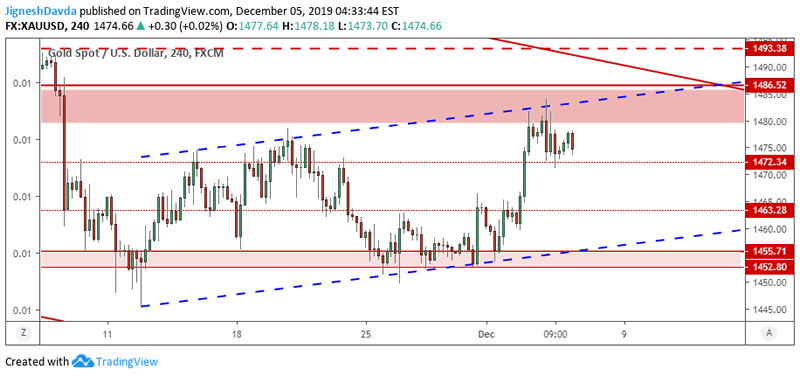
On a 4-hour chart, the shiny metal is also facing resistance at the upper bound of a rising trend channel. This channel has encompassed price action in the recovery that started around the middle of November.
The charts suggest to me that there might be some potential for one more leg higher, but I favor a bearish continuation at this stage, in line with the trend we’ve been seeing since the start of September.
By Jignesh Davda
https://www.thegoldanalyst.com
Copyright 2019 © Jignesh Davda - All Rights Reserved
Disclaimer: The above is a matter of opinion provided for general information purposes only and is not intended as investment advice. Information and analysis above are derived from sources and utilising methods believed to be reliable, but we cannot accept responsibility for any losses you may incur as a result of this analysis. Individuals should consult with their personal financial advisors.
© 2005-2022 http://www.MarketOracle.co.uk - The Market Oracle is a FREE Daily Financial Markets Analysis & Forecasting online publication.