Adaptive Predictive Modeling Suggests Stock Market Weakness Into 2020
Stock-Markets / Stock Markets 2019 Nov 22, 2019 - 03:14 PM GMTBy: Chris_Vermeulen
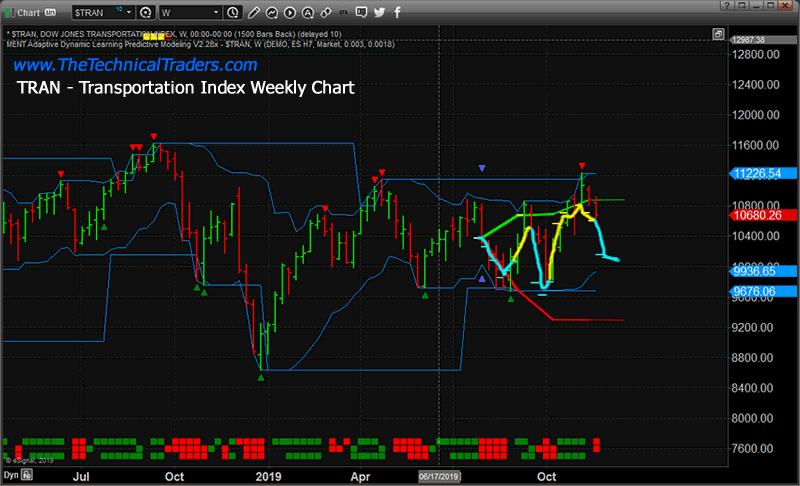
 Our Adaptive Dynamic Learning (ADL) predictive modeling system is suggesting the Transportation Index will fall to levels near $10,000 over the next 2 to 3 weeks which would indicate moderate price weakness in the US stock market and the global stock market.
Our ADL predictive modeling system attempts to model future price activity by finding and mapping critical price and technical elements within the historical price action. In a way, this is like mapping the future by attempting to learn from the past. You can get all of my trade ideas by opting into my free market trend signals newsletter.
Weekly Transportation Index Chart #1
This first Weekly Transportation Index chart highlights the ADL predictive modeling results since the end of July 2019. Notice the CYAN and YELLOW lines drawn on this chart showing what the ADL predictive modeling system suggested would happen over time. This Technical ADL pattern consisted of SIX historical reference points and suggests the last three weeks’ price levels have a 63 to 84% probability rate. This would indicate a fairly strong probability that prices will fall as the ADL predicts.

Weekly Transportation Index Chart #2
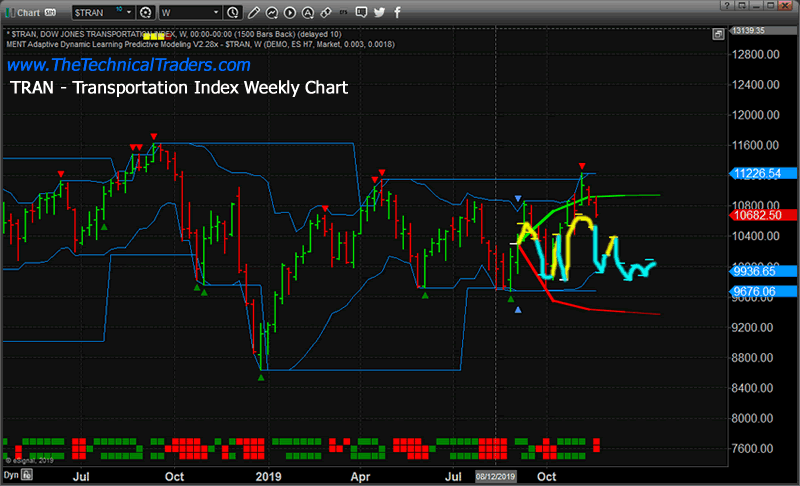
This second Weekly Transportation Index chart highlights the ADL predictive modeling results from early September 2019. The results are quite similar across these two charts. Although the September results highlight a bit more potential price rotation than the earlier July ADL results.
This September ADL predictive modeling chart suggests the TRAN price will fall dramatically to levels below $10,000, then recover a bit. After that, the price will continue to settle near the $9,700 to $10,000 level throughout the end of 2019. This downside price move in the Transportation Index suggests the US and Global markets will experience some extended price weakness over the next 3 to 6+ weeks.

The decline in the Transportation Index suggests an overall weakness in the global economy. If that translates into true price action in the global markets, we could see a series of lower lows set up in the US Stock Market over the next 4 to 6+ weeks.
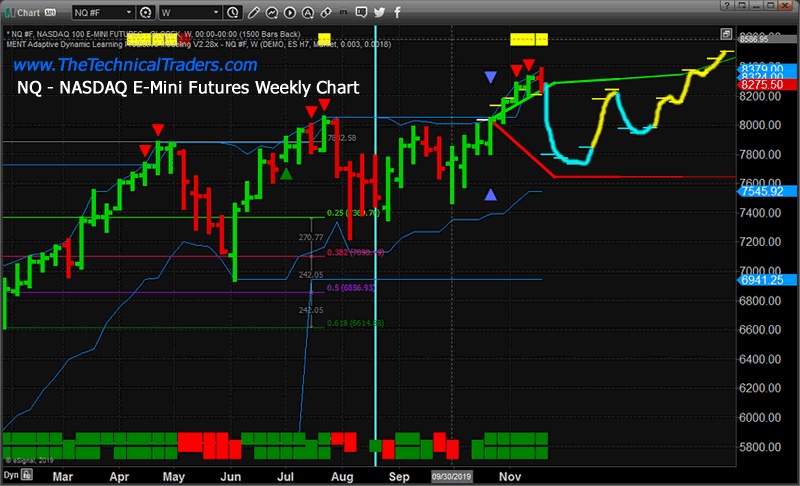
General price weakness may become a waning anthem for the global stock market headed into the start of 2020. Take a look at this NQ (Nasdaq) Weekly ADL chart to see what our predictive modeling system is suggesting will happen over the next 60 to 10+ weeks.

If our ADL predictive modeling system is correct, the NQ will fall to price levels near or below $7,700 over the next 2 to 4+ weeks before attempting to settle near $8000 near the end of 2019. A couple of days ago I shared an interesting article talking about the VIX ready to rocket higher which is linked to this pending decline. As a word of warning, the price can, and often does, move beyond the ADL predictive levels on extended/volatile price swings. So be prepared for what may happen as price rotates.
As we are nearing the US Thanksgiving holiday weekend, we wanted to alert you to the fact that we’ve created incredible Black Friday membership subscription options for all of our followers to take advantage of. These special savings rates will run through the end of November – so don’t miss out by joining the Wealth Building Newsletter right now!
Chris Vermeulen
www.TheTechnicalTraders.com
Chris Vermeulen has been involved in the markets since 1997 and is the founder of Technical Traders Ltd. He is an internationally recognized technical analyst, trader, and is the author of the book: 7 Steps to Win With Logic
Through years of research, trading and helping individual traders around the world. He learned that many traders have great trading ideas, but they lack one thing, they struggle to execute trades in a systematic way for consistent results. Chris helps educate traders with a three-hour video course that can change your trading results for the better.
His mission is to help his clients boost their trading performance while reducing market exposure and portfolio volatility.
He is a regular speaker on HoweStreet.com, and the FinancialSurvivorNetwork radio shows. Chris was also featured on the cover of AmalgaTrader Magazine, and contributes articles to several leading financial hubs like MarketOracle.co.uk
Disclaimer: Nothing in this report should be construed as a solicitation to buy or sell any securities mentioned. Technical Traders Ltd., its owners and the author of this report are not registered broker-dealers or financial advisors. Before investing in any securities, you should consult with your financial advisor and a registered broker-dealer. Never make an investment based solely on what you read in an online or printed report, including this report, especially if the investment involves a small, thinly-traded company that isn’t well known. Technical Traders Ltd. and the author of this report has been paid by Cardiff Energy Corp. In addition, the author owns shares of Cardiff Energy Corp. and would also benefit from volume and price appreciation of its stock. The information provided here within should not be construed as a financial analysis but rather as an advertisement. The author’s views and opinions regarding the companies featured in reports are his own views and are based on information that he has researched independently and has received, which the author assumes to be reliable. Technical Traders Ltd. and the author of this report do not guarantee the accuracy, completeness, or usefulness of any content of this report, nor its fitness for any particular purpose. Lastly, the author does not guarantee that any of the companies mentioned in the reports will perform as expected, and any comparisons made to other companies may not be valid or come into effect.
Chris Vermeulen Archive |
© 2005-2022 http://www.MarketOracle.co.uk - The Market Oracle is a FREE Daily Financial Markets Analysis & Forecasting online publication.


