


Welcome to the Zombie-land Of Oil, Gold and Stocks Investing – Part II
Commodities / Gold & Silver 2019 Nov 12, 2019 - 03:41 PM GMTBy: Chris_Vermeulen

 In Part I of this research post, we highlight how the ES and Gold reacted 24+ months prior to the 2007-08 market peak and subsequent collapse in 2008-09. The point we were trying to push out to our followers was that the current US stock market indexes are acting in a very similar formation within a very mature uptrend cycle.
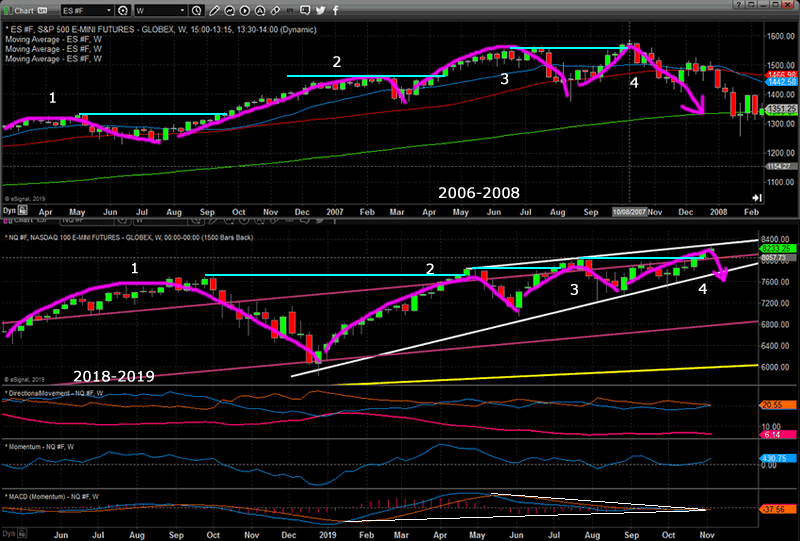
We ended Part I with this chart, below, comparing 2006-08 with 2018-19. Our intent was to highlight the new price high similarities as well as the price rotation similarities between the two critical peaks in market price. We are terming the current market a “Zombie-land” because it appears global investors are somewhat brain-dead as to the total risks that are setting up in the global markets right now. But, wait before you continue reading make sure to opt-in to our free market trend signals newsletter.
Forward guidance is waning. Earning expectations are decreasing. Debt levels are skyrocketing all over the planet. Global banks are continuing to move into more Quantitative Easing measures to attempt to spark growth. The equity markets are 9+ years into a rally while the global central banks are 10+ years into some form of continued QE efforts. Global economic data suggests a moderate downturn in economic activity and growth for many foreign nations. We believe the next crisis will not originate in the US, but from outside the US. We believe the risks associated with the massive debt levels in the foreign markets will be the reason for another price decline. Quite possibly, a commodity price collapse (think OIL) will become the catalyst for this event.
If Oil were to fall below $45…
If Oil were to fall below $45 (eventually possibly flirting with the $30 price level) as our predictive modeling suggests, then we believe many foreign nations will suddenly become serious risk factor related to debt/credit and could potentially create a domino-process where the US/Global markets collapse on this new risk factor. Our last predictive model signal was for natural gas and we just close out the trade locking in 19% profits this week.
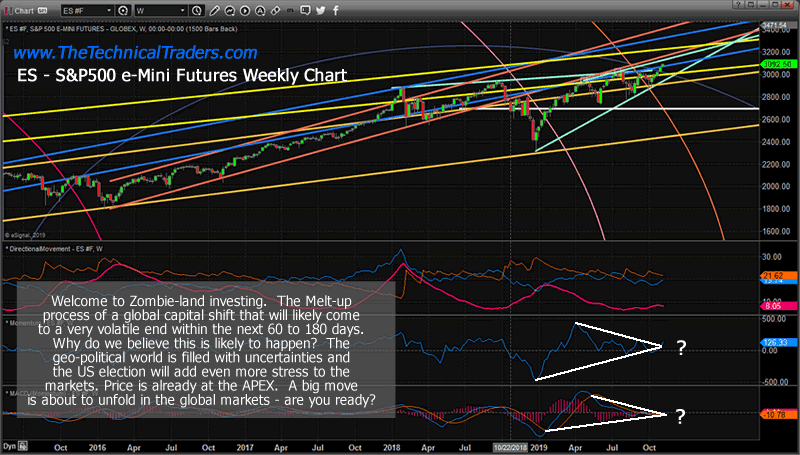
Is 2007 setting up all over again?
But what if this is 2007 setting up all over again? Take a look at the ES chart above – where a peak setup in May/June 2007, followed by a deep price correction. Follow that price move even further to see how price rallied to a new all-time high throughout July, August and most of September before setting up in a deeper price rotation in late September and carrying forward into October. Now, take a look at this current ES Weekly chart to see if there is any similarity between them.
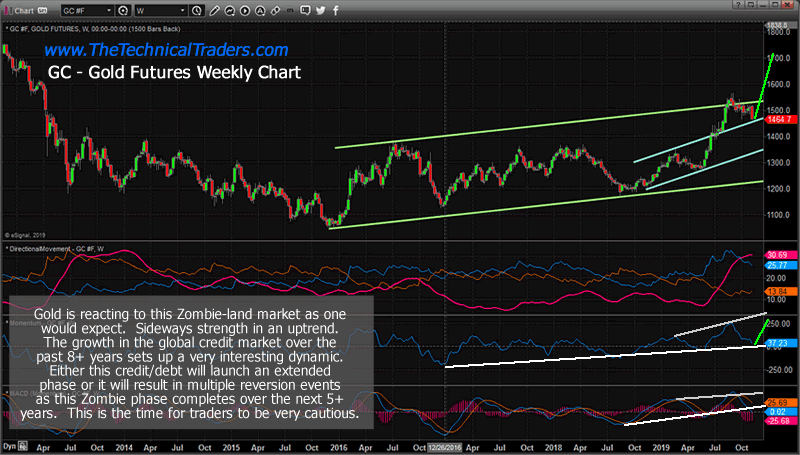
Gold up 50% From Its Lows Already
Gold has already rallied nearly 49% from the 2015 lows and the recent price rotation is somewhat similar to what happened to Gold in 2006-2007. The extended base that set up between 2017 and 2018 could be interpreted as a similar type of base that set up in 2006-07. The current rally is somewhat similar to what happened in late 2007 and early 2008 when the US stock market began to collapse volatility expanded in a strong uptrend which was followed by a moderate price retracement before Gold began a rally totaling more than 250% from the base/bottom. Is this setup happening again right now?
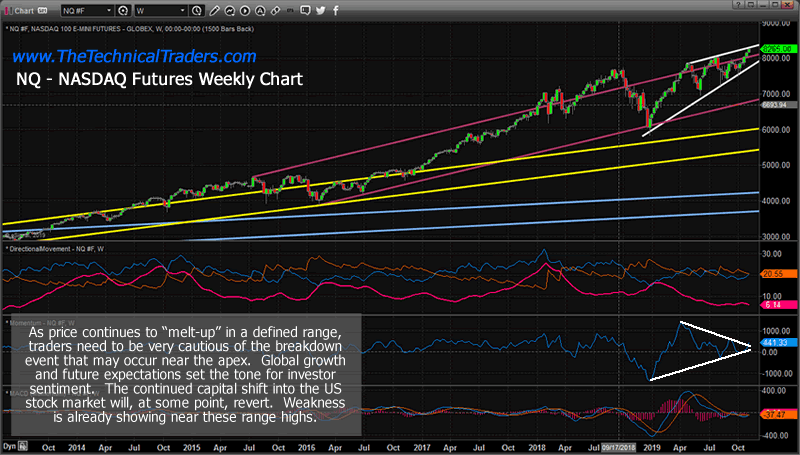
Weekly NQ chart shows the extended melt-up
This Weekly NQ chart shows the extended melt-up that is taking place after the October to December deep price rotation that took place in 2018. We believe this deep price rotation is similar to the deep price rotation that happened between July and September 2007. The subsequent “melt-up” process is a function of the “zombie-land” function of price and bias. Investors chase after security and returns by pushing the price higher and higher when fundamentals and expectations don’t align with these expectations. This same type of “zombie-land melt-up” happened in 2007 as well.
We understand the implications of this research post and want to warn all of our followers they need to be extremely cautious of the current market setup. Even though the US stock market may continue an upside bias within a melt-up process, we believe there are very strong underlying risks in the markets that could prompt a very deep price correction.
The US Fed is not lowering rates because …
The US Fed is not lowering rates because of market strength and super strong forward guidance. They are lowering rates because they believe risks exist in the debt/credit market and are trying to stay ahead of a big problem – a potentially very big problem. The overnight REPO market has been a topic for our researchers for the past 45+ days as this temporary institutional debt tool has exploded recently. Now, the US Fed has actively decreased rates and has begun acquiring more debt on its balance sheet.. hmm. That seems strangely similar to another credit/debt crisis event.
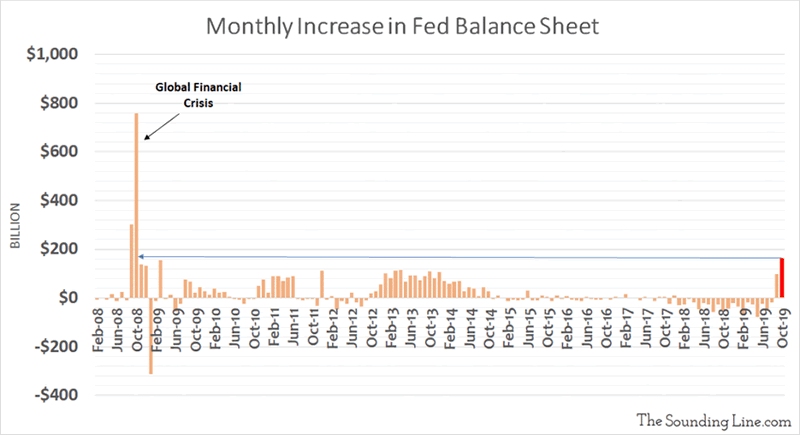
(source: https://thesoundingline.com/october-saw-the-largest-increase-in-feds-balance-sheet-since-the-financial-crisis/)
We know many of our followers may consider this just another warning from a bunch of doom-sayers again. We’re not wishing for this outcome – trust us. We simply look at the technical data, determine a probable outcome and present our findings to our followers to try to keep them informed.
Too many similarities are starting to align to make this just some strange coincidence. Too many unknowns and uncertainties are aligning just 12 months before a US presidential election cycle. It seems strangely familiar to us that these same types of price events are unfolding now. If there is no correlation then we’ll likely be incorrect in our analysis. But if we are right and there is a major price reversion event setting up, we think it is wise to alert as many of our friends as possible.
Keep reading our research because our proprietary tools have been nailing all of these price targets and move many months in advance.
I urge you visit my ETF Wealth Building Newsletter and if you like what I offer, join me with the 1-year subscription to lock in the lowest rate possible and ride my coattails as I navigate these financial market and build wealth while others lose nearly everything they own during the next financial crisis. Join Now and Get a Free 1oz Silver Bar!
As a technical analysis and trader since 1997, I have been through a few bull/bear market cycles. I believe I have a good pulse on the market and timing key turning points for both short-term swing trading and long-term investment capital. The opportunities are massive/life-changing if handled properly.
Chris Vermeulen
www.TheTechnicalTraders.com
Chris Vermeulen has been involved in the markets since 1997 and is the founder of Technical Traders Ltd. He is an internationally recognized technical analyst, trader, and is the author of the book: 7 Steps to Win With Logic
Through years of research, trading and helping individual traders around the world. He learned that many traders have great trading ideas, but they lack one thing, they struggle to execute trades in a systematic way for consistent results. Chris helps educate traders with a three-hour video course that can change your trading results for the better.
His mission is to help his clients boost their trading performance while reducing market exposure and portfolio volatility.
He is a regular speaker on HoweStreet.com, and the FinancialSurvivorNetwork radio shows. Chris was also featured on the cover of AmalgaTrader Magazine, and contributes articles to several leading financial hubs like MarketOracle.co.uk
Disclaimer: Nothing in this report should be construed as a solicitation to buy or sell any securities mentioned. Technical Traders Ltd., its owners and the author of this report are not registered broker-dealers or financial advisors. Before investing in any securities, you should consult with your financial advisor and a registered broker-dealer. Never make an investment based solely on what you read in an online or printed report, including this report, especially if the investment involves a small, thinly-traded company that isn’t well known. Technical Traders Ltd. and the author of this report has been paid by Cardiff Energy Corp. In addition, the author owns shares of Cardiff Energy Corp. and would also benefit from volume and price appreciation of its stock. The information provided here within should not be construed as a financial analysis but rather as an advertisement. The author’s views and opinions regarding the companies featured in reports are his own views and are based on information that he has researched independently and has received, which the author assumes to be reliable. Technical Traders Ltd. and the author of this report do not guarantee the accuracy, completeness, or usefulness of any content of this report, nor its fitness for any particular purpose. Lastly, the author does not guarantee that any of the companies mentioned in the reports will perform as expected, and any comparisons made to other companies may not be valid or come into effect.
Chris Vermeulen Archive |
© 2005-2022 http://www.MarketOracle.co.uk - The Market Oracle is a FREE Daily Financial Markets Analysis & Forecasting online publication.