


Is Silver About To Become The Super-Hero Of Precious Metals?
Commodities / Gold & Silver 2019 Sep 24, 2019 - 06:24 PM GMTBy: Chris_Vermeulen

 If you’ve been following our research, you already know how accurately we’ve been nailing the precious metals price moves. We’ve been calling Gold and Silver accurately since early 2018 and continue to focus a good portion of our efforts in studying these incredible setups. Let’s have a little fun and start with two charts from near July 20, 2019, to help our followers understand what we’ve been expecting, but first, be sure to opt-in to our free market research newsletter
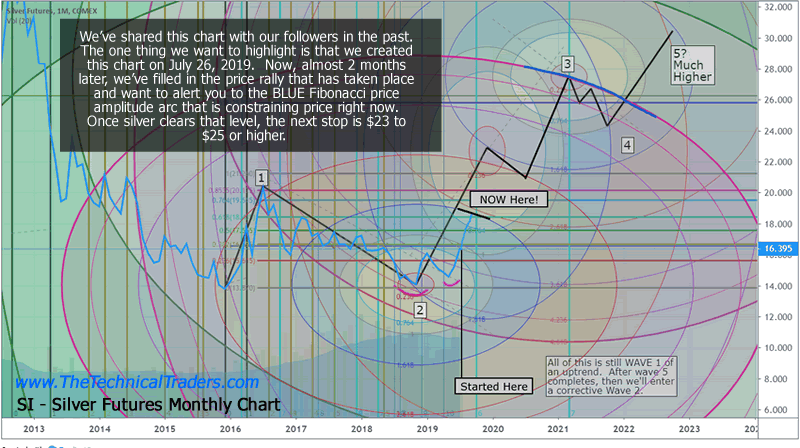
This first Monthly Silver chart highlights what we believed would be the approximate wave structure of the silver price advance going forward. We did not attempt to accurately time these peaks of valleys, we simply used our Fibonacci Price Amplitude Arcs to allow price to tell us where these peaks may form. From those levels, we used our best “guess” to identify the trough bottoms.
You can see a “Started Here” line near the bottom of this chart. This highlights where we created this chart and where the price was when we first posted it in our research (near $16.39). As of today, the price of Silver is near $18.75 and climbing. We’ve drawn in the missing data on this chart and highlighted the endpoint with a “NOW Here!” message. Once the price of silver breaks above that BLUE Fibonacci Price Amplitude Arc, it should rally up to $23 to $25 before finding new resistance.
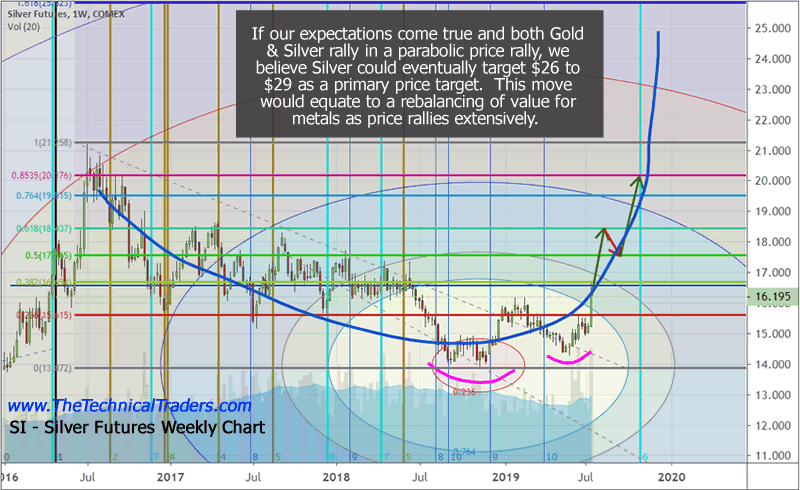
Silver Weekly Chart
This next Silver Weekly chart was shared with our members near July 25, 2019. Pay very close attention to the arrows we drew on the chart at that time. Guess what the price of Silver actually did after this chart was shared with our readers? Yup, Silver shot up to $19.75 in early September, rotated back to the $17.50 level near the middle of September, and is starting a new rally towards the $23 to $25+ level right now. Does that look familiar to you on this chart (below)?
If this seems amazing to you because we were able to see these moves so accurately into the future and had such a keen insight into the future metals price rotation – don’t be alarmed. Our proprietary research tools are second to none. Our team of researchers have more than 54 years of experience in the markets and have studied almost all types of price theory, technical analysis, and other types of market price, technical, and fundamental analysis techniques. We put our skills to the test every day in order to help our clients find and execute the best trades. If you want to see more of our trading indicators and tools click here.
What Next?
What next? Well, the charts above actually show you what’s next. The new charts, below, highlight new charts and new triggers that we believe will drive the current rally in Silver even higher.
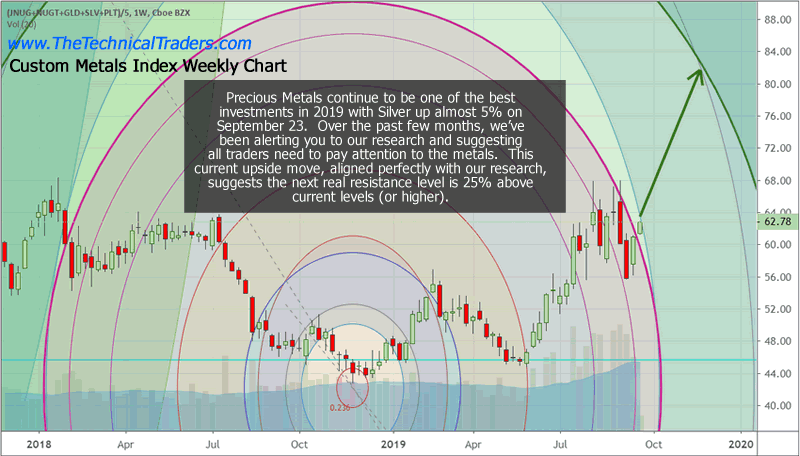
Take notice of the HEAVY MAGENTA Fibonacci Price Amplitude Arc. The reason we highlight this MAGENTA level and the GREEN level in heavier line drawn is because these levels tend to become the major price inflection points within the arcs. In other words, these levels are where the price will either stall/reverse or breakout of a trend and possibly explode into a bigger price trend. The current Magenta line has just been crossed and the price is already exploding to the upside. If this continues as we expect, this Weekly Custom Metals Index could rally another 25% higher – which would put Gold well above $1800 per ounce and Silver well above $24 per ounce.
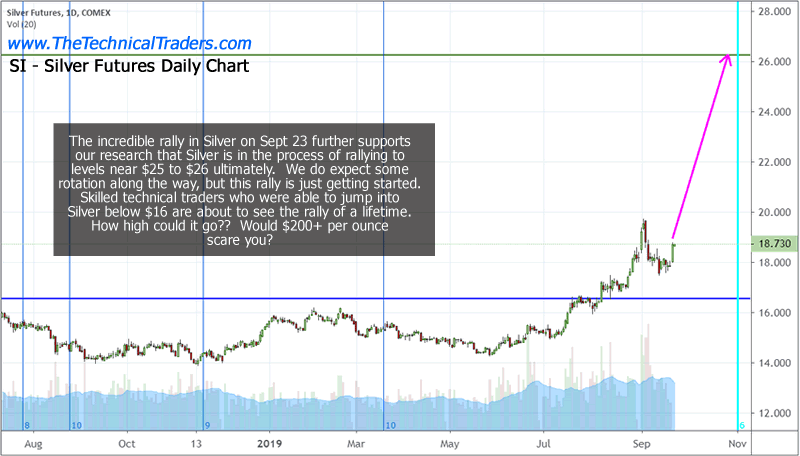
Silver Daily Chart
This last Silver Daily chart is our Silver Cycle chart. It shows that we expect Silver to reach levels above $23 to $25 before early November 2019. That means Silver could rally 20~25% from current levels within the next 30+ days to reach our current upside targets. Are you ready?
On Tuesday the stock market was hit with heavy selling volume sending money into the safe haven equities sector which was the XLU utilities ETF. We we in position for a wave of fear and locked in 2.72% on XLU with subscribers.
If you’ve missed any of our past analysis, please take a minute to visit our site to learn how our team of skilled researchers can help you find and execute better trades. This move in the metals markets is going to be an incredible opportunity. We’ve been alerting our members of this opportunity for months. If you are not prepared for this move and/or want to learn how we can help you, please review our trade signal Wealth Building Newsletter today.
Chris Vermeulen
www.TheTechnicalTraders.com
Chris Vermeulen has been involved in the markets since 1997 and is the founder of Technical Traders Ltd. He is an internationally recognized technical analyst, trader, and is the author of the book: 7 Steps to Win With Logic
Through years of research, trading and helping individual traders around the world. He learned that many traders have great trading ideas, but they lack one thing, they struggle to execute trades in a systematic way for consistent results. Chris helps educate traders with a three-hour video course that can change your trading results for the better.
His mission is to help his clients boost their trading performance while reducing market exposure and portfolio volatility.
He is a regular speaker on HoweStreet.com, and the FinancialSurvivorNetwork radio shows. Chris was also featured on the cover of AmalgaTrader Magazine, and contributes articles to several leading financial hubs like MarketOracle.co.uk
Disclaimer: Nothing in this report should be construed as a solicitation to buy or sell any securities mentioned. Technical Traders Ltd., its owners and the author of this report are not registered broker-dealers or financial advisors. Before investing in any securities, you should consult with your financial advisor and a registered broker-dealer. Never make an investment based solely on what you read in an online or printed report, including this report, especially if the investment involves a small, thinly-traded company that isn’t well known. Technical Traders Ltd. and the author of this report has been paid by Cardiff Energy Corp. In addition, the author owns shares of Cardiff Energy Corp. and would also benefit from volume and price appreciation of its stock. The information provided here within should not be construed as a financial analysis but rather as an advertisement. The author’s views and opinions regarding the companies featured in reports are his own views and are based on information that he has researched independently and has received, which the author assumes to be reliable. Technical Traders Ltd. and the author of this report do not guarantee the accuracy, completeness, or usefulness of any content of this report, nor its fitness for any particular purpose. Lastly, the author does not guarantee that any of the companies mentioned in the reports will perform as expected, and any comparisons made to other companies may not be valid or come into effect.
Chris Vermeulen Archive |
© 2005-2022 http://www.MarketOracle.co.uk - The Market Oracle is a FREE Daily Financial Markets Analysis & Forecasting online publication.