Stock Market Dow to 38,000 by 2022
Stock-Markets / Stock Markets 2019 Sep 13, 2019 - 08:15 AM GMTBy: readtheticker
 President Trump said the Dow would be 10,000 points higher if it was not for the FED. In truth if the Dow breaks to new all time highs the next stop is 38,000 and he may be proven correct. Is there an election on?
Of course who knows? But lets continue.
The fundamentals behind this may be:
- A good deal with China.
- The FED turning on easy money with further rate cuts (very strange with a market near all time highs). FOMC Sept 17th well tell us more.
- The above turbo charging stock buy backs.
- Off shore money running out of foreign equity markets in to US markets (see note1).
Note1: Of course this has happened before, one particular time was just before Oct 1987 stock market crash, as it was proven the US stock market does not act in isolation, and can not escape the world economic environment, hence the quick and sharp stock market correction Oct 19 1987.
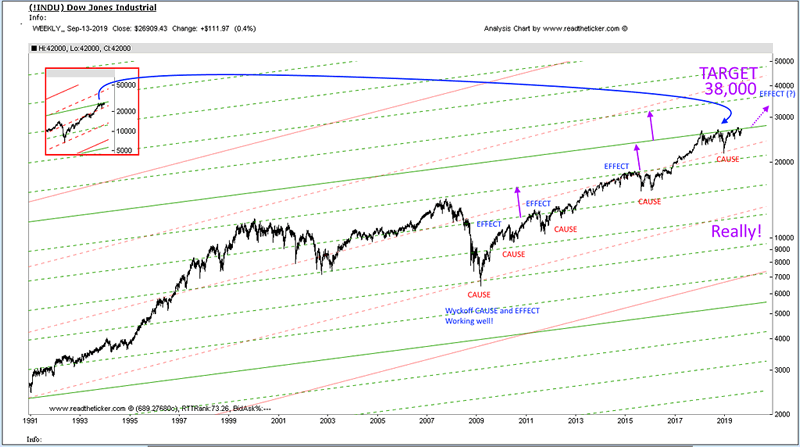
In the chart below:

- Notice how the Dow moves in burst between the green divider channel lines. It like an even pulse of a market move.
- The most recent consolidation is a Wyckoff re accumulation cause (well so far) and the effect would carry stocks to 38,000. It is not distribution as one would expect more volatility and we do not have that.
- 38,000 target is the next green outer channel line.
Dow 1 Wyckoff
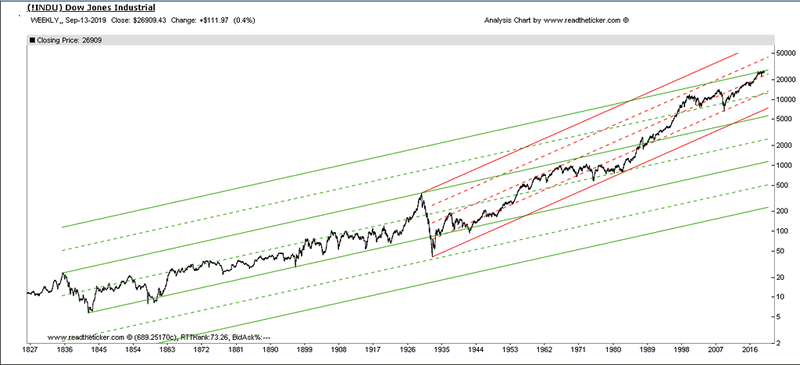
Here is the longer term view of the red and green channels.

Fundamentals are important, and so is market timing, here at readtheticker.com we believe a combination of Gann Angles, Cycles, Wyckoff and Ney logic is the best way to secure better timing than most, after all these methods have been used successfully for 70+ years. To help you applying Richard Wyckoff and Richard Ney logic a wealth of knowledge is available via our RTT Plus membership. NOTE: readtheticker.com does allow users to load objects and text on charts, however some annotations are by a free third party image tool named Paint.net Investing
NOTE: readtheticker.com does allow users to load objects and text on charts, however some annotations are by a free third party image tool named Paint.net
Readtheticker
My website: www.readtheticker.com
We are financial market enthusiast using methods expressed by the Gann, Hurst and Wyckoff with a few of our own proprietary tools. Readtheticker.com provides online stock and index charts with commentary. We are not brokers, bankers, financial planners, hedge fund traders or investment advisors, we are private investors
© 2019 Copyright readtheticker - All Rights Reserved
Disclaimer: The material is presented for educational purposes only and may contain errors or omissions and are subject to change without notice. Readtheticker.com (or 'RTT') members and or associates are NOT responsible for any actions you may take on any comments, advice,annotations or advertisement presented in this content. This material is not presented to be a recommendation to buy or sell any financial instrument (including but not limited to stocks, forex, options, bonds or futures, on any exchange in the world) or as 'investment advice'. Readtheticker.com members may have a position in any company or security mentioned herein.
© 2005-2022 http://www.MarketOracle.co.uk - The Market Oracle is a FREE Daily Financial Markets Analysis & Forecasting online publication.


