Is the Stock Market Making a V-shaped Recovery?
Stock-Markets / Stock Markets 2019 Aug 11, 2019 - 03:04 PM GMTBy: Troy_Bombardia
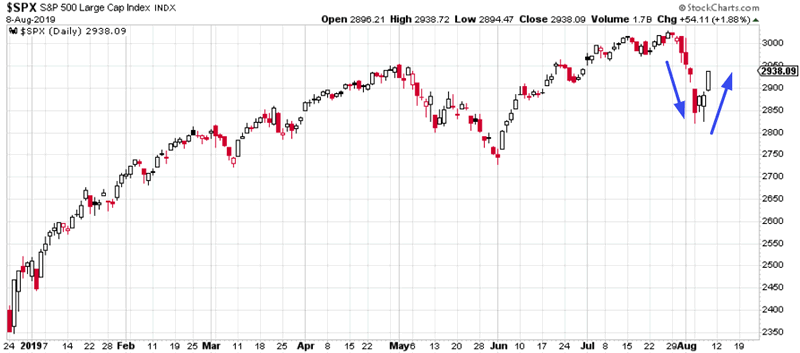
 The U.S. stock market continues to rally. V-shaped rallies are uncommon, but not impossible. Today’s headlines:
- V-shaped bounce
- Volatility is falling
- % of stocks above their 50 dma is rising
- AAII sentiment crashed
- NAAIM sentiment crashed
Go here to understand our long term outlook. For reference, here’s the random probability of the U.S. stock market going up on any given day.

V-shaped bounce
The S&P fell 6 days in a row, and is now up 3 days in a row.
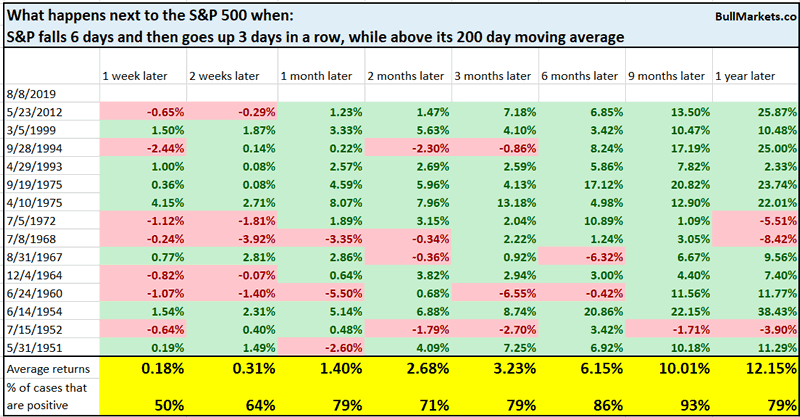
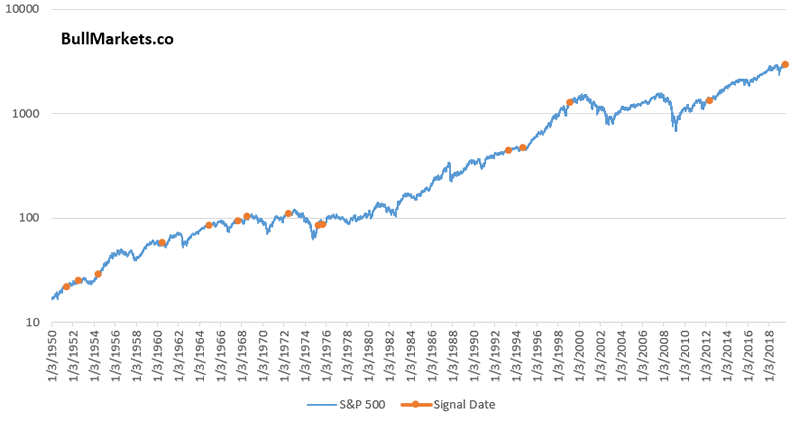
When this happened in the past, the S&P often bounced over the next month. More importantly, V-shaped bounces were almost exclusively bullish for the S&P 9 months later.
Volatility
But as I said, V-shaped recoveries are not very common.
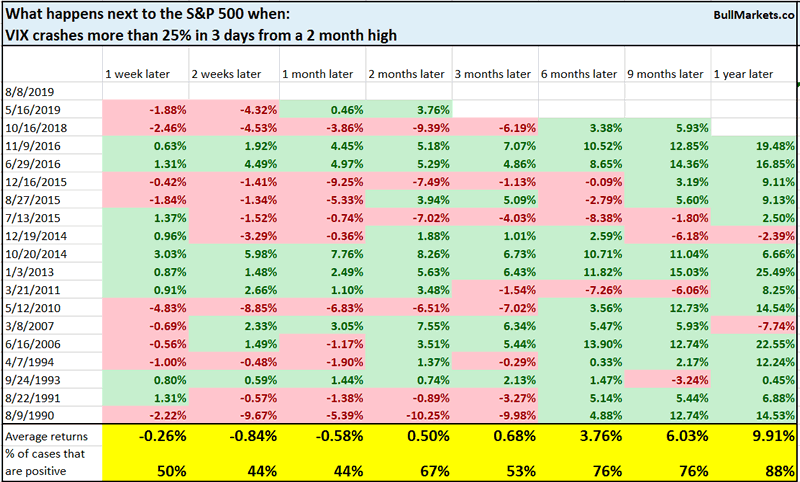
VIX has fallen more than 25% in just 3 days from a 2 month high.
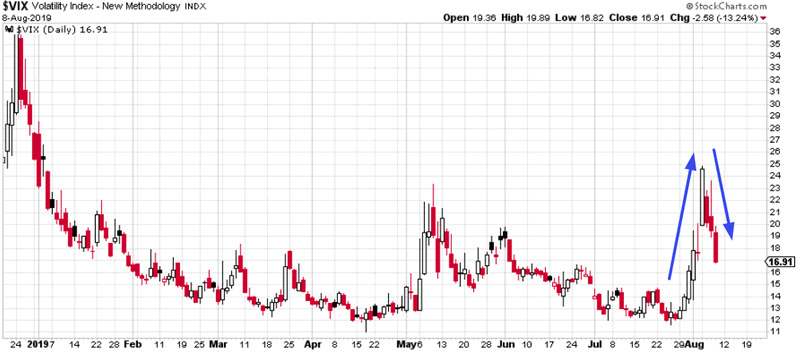
When this happened in the past, the S&P faced some short term weakness over the next 2 weeks.
% of stocks above their 50 dma is rising
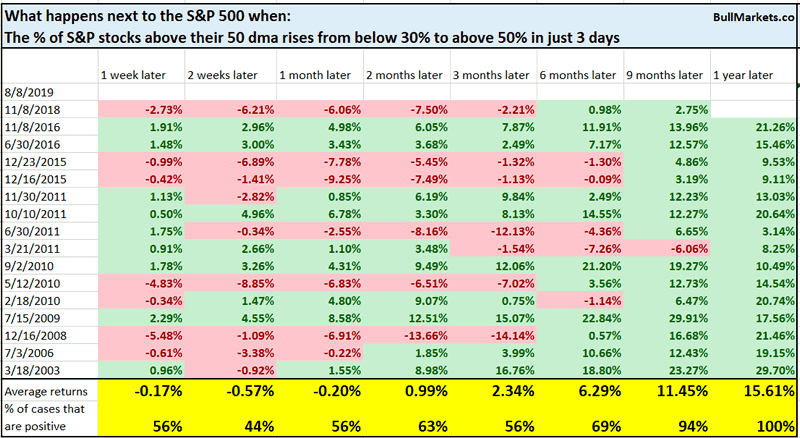
The % of S&P stocks above their 50 dma fell below 30% a few days ago, and is now back above 50%. Since the “% of S&P stocks above their 50 dma” closely tracks the S&P’s distance from its 50 dma, this demonstrates a fairly rapid stock market recovery to the S&P’s 50 dma.

When this happened in the past, the S&P sometimes faced short term weakness over the next 2 weeks. Rapid recoveries don’t always work out on the first try.
AAII sentiment
Due to the stock market’s rapid decline last week, various sentiment indicators plunged. For example, the AAII Bull-Bear spread fell below -26% (26% more bears than bulls).
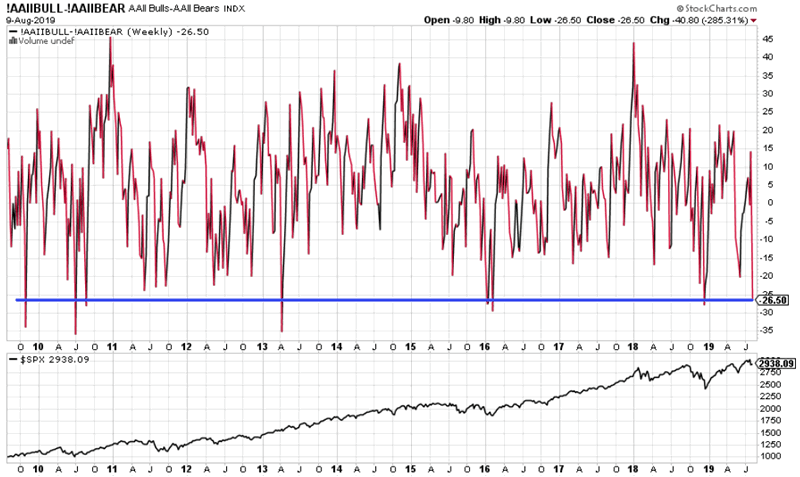
This is uncommon. Most Bull-Bear spreads that are this low occur when the S&P is in a downtrend, i.e. below its 200 dma. I guess trade war headlines really spooked a lot of investors and traders.
Here’s what happened next to the S&P when the AAII Bull-Bear spread fell below -20%, while the S&P is above its 200 dma.
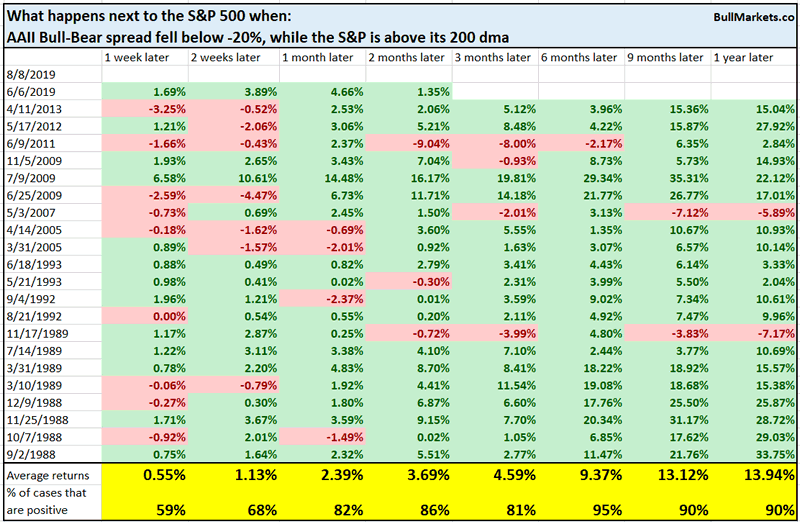

As you can see, the S&P’s 2-12 month forward returns are mostly bullish. However, I would caution investors and traders that the AAII sentiment survey isn’t the best sentiment indicator. This survey is created from 300-500 responses each week, so the sample size isn’t big.
NAAIM
The NAAIM Exposure Index is another popular sentiment indicator that represents that exposure to equities by active managers.
Like AAII, NAAIM tanked this week.
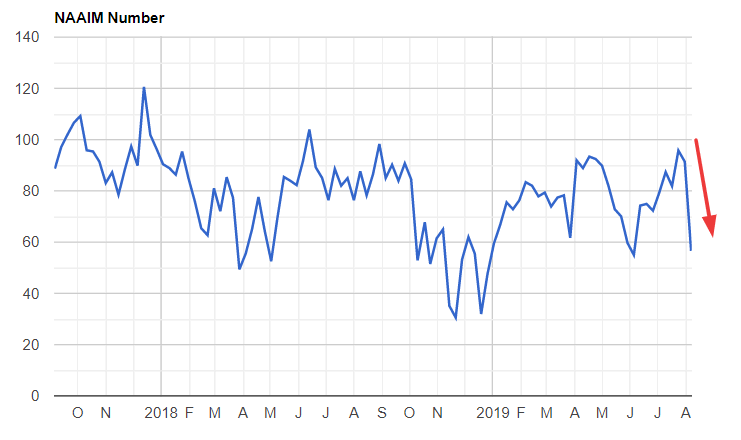
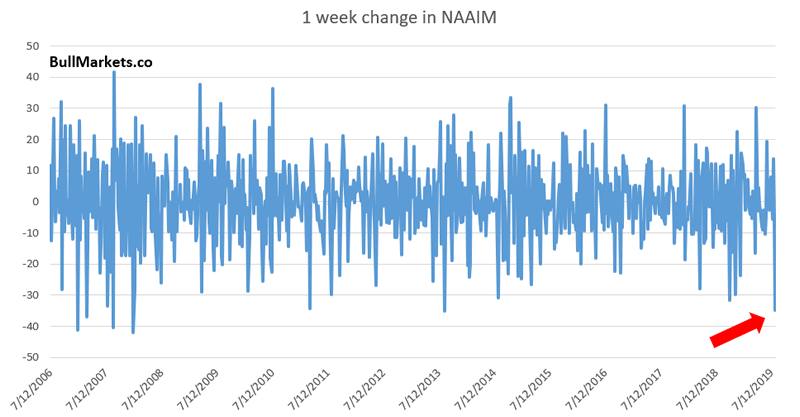
This is one of the largest 1 week drops in NAAIM.
When this happened in the past, the S&P mostly went up over the next 2 weeks – 3 months.

We don’t use our discretionary outlook for trading. We use our quantitative trading models because they are end-to-end systems that tell you how to trade ALL THE TIME, even when our discretionary outlook is mixed. Members can see our model’s latest trades here updated in real-time.
Conclusion
Here is our discretionary market outlook:
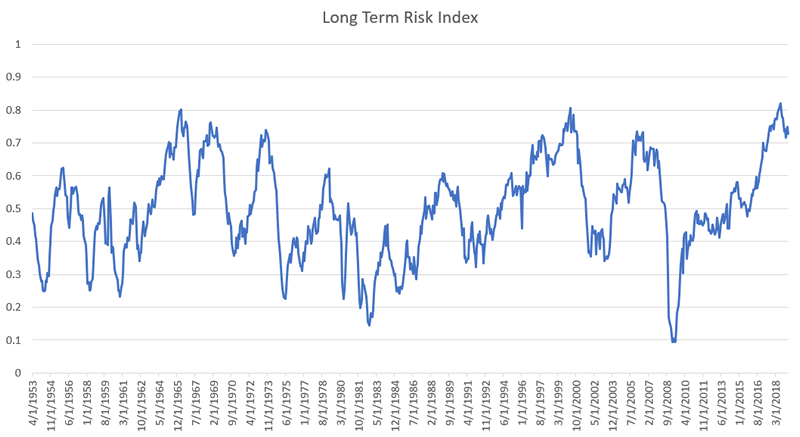
- Long term: risk:reward is not bullish. In a most optimistic scenario, the bull market probably has 1 year left.
- Medium term (next 6-9 months): most market studies lean bullish.
- Short term (next 1-3 months) market studies are mixed.
- We focus on the medium-long term.
Goldman Sachs’ Bull/Bear Indicator demonstrates that risk:reward favors long term bears.
Click here for more market analysis
By Troy Bombardia
I’m Troy Bombardia, the author behind BullMarkets.co. I used to run a hedge fund, but closed it due to a major health scare. I am now enjoying life and simply investing/trading my own account. I focus on long term performance and ignore short term performance.
Copyright 2019 © Troy Bombardia - All Rights Reserved
Disclaimer: The above is a matter of opinion provided for general information purposes only and is not intended as investment advice. Information and analysis above are derived from sources and utilising methods believed to be reliable, but we cannot accept responsibility for any losses you may incur as a result of this analysis. Individuals should consult with their personal financial advisors.
Troy Bombardia Archive |
© 2005-2022 http://www.MarketOracle.co.uk - The Market Oracle is a FREE Daily Financial Markets Analysis & Forecasting online publication.


