Technical Analysis of US Major Stocks
Stock-Markets / US Stock Markets Aug 08, 2019 - 05:48 PM GMTBy: Justin_Weinger
Microsoft (MSFT)
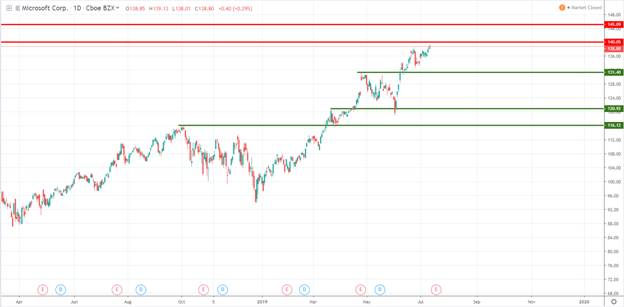
At the present time, Microsoft is one of the best-performing major US stocks, up 59% since January 2019. Even though the tech sector had quite a bumpy ride for the past year and a half, the major software company continued to advance higher, exceeding the $1 trillion market cap valuation.

Source: tradingview.com
Technically speaking, we could see the stock price encountering resistance around $140 or 145$ zones, given that we’re in uncharted territory and we have to look round numbers. Although the stock had been a major outperformer, we could be closer to a correction than to a major continuation on the upside.
If the stock will start to weaken, previous all-time highs, located around $131.4, $120.9, and $116.1 respectively, should act as support in the face of selling pressure.
Apple (AAPL)
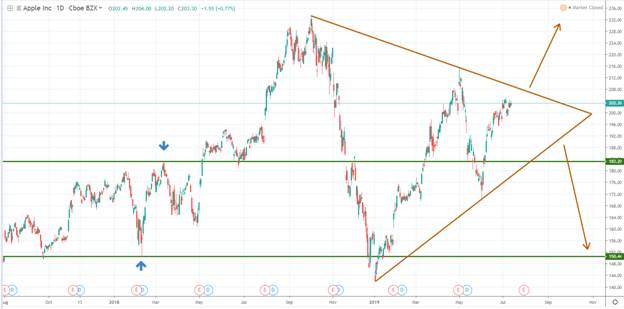
Currently among the Capex share trading popular instruments, the AAPL stock is locked inside a triangle formation, communicating a sense of indecision from market participants. Although the price managed to rebound substantially from the January 2019 lows, it does not show that the order flow is heavily biased towards the buy side and that at least a retest of the all-time high could happen anytime soon.

Source: tradingview.com
Both sides of the triangle had been confirmed by two points, and now traders need to see whether the structure will be broken on the upside, or a new correction lower will occur. July 30th is the next earnings date and it could function as a catalyzer for the next big move unless any significant event happens until then.
Boeing (BA)
Two plane crashes put the Boeing stock under pressure, as the company faces a great loss of credibility among customers. United Airlines already announced an extension for the Boeing 737 Max flights until October and that could impact how the BA stock will perform in the next few weeks or months.

Source: tradingview.com
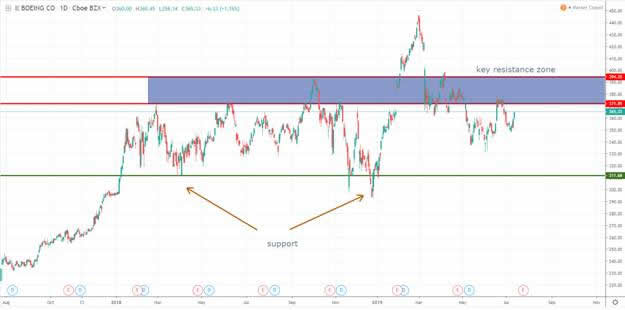
Looking at the chart, we can easily notice a false breakout formation, with the $371-$394 resistance zone as the main component. So far, the price did not manage to break back above that area, a sign of weakness that could signal further losses for the price.
As long as it won’t manage to break above the resistance zone, the BA stock seems poised for further losses, with a potential downside target located around $311, where important reactions from the buyers can be spotted.
Risk Warning:
The information presented herein does not constitute and does not intend to constitute Investment Advice. The information contained herewith is a compilation of public stock recommendations issued by various financial analysts and organized by Live News Recommendation in an easily presentable format, for information purposes only.
Key Way Investments Ltd does not influence nor has any input in formulating the information contained herein. The content herewith is generic and does not take into consideration individual personal circumstances, investment experience or current financial situation. Users/readers should not rely solely on the information presented herewith and should do their own research/analysis by also reading the actual underlying research. Users/readers should also consider the risk of encountering significant losses when trading CFDs. Therefore, Key Way Investments Ltd shall not accept any responsibility for any losses of traders due to the use and the content of the information presented herein. Past performance is not a reliable indicator of future results.
HIGH RISK INVESTMENT WARNING: CFDs are complex instruments and come with a high risk of losing money rapidly due to leverage. 78.20% of retail investor accounts lose money when trading CFDs with this provider. You should consider whether you understand how CFDs work and whether you can afford to take the high risk of losing your money
By Justin Weinger
The materials contained on this document have been created in cooperation with Vestle UK and should not in any way be construed, either explicitly or implicitly, directly or indirectly, as investment advice, recommendation or suggestion of an investment strategy with respect to a financial instrument, in any manner whatsoever. CFDs are complex instruments and come with a high risk of losing money rapidly due to leverage. 59.5% of retail investor accounts lose money when trading CFDs with this provider. You should consider whether you understand how CFDs work and whether you can afford to take the high risk of losing your money. Any indication of past performance or simulated past performance included in this document is not a reliable indicator of future results. Full disclaimer: https://www.vestle.co.uk/legal/analysis-disclaimer.html
© 2019 Copyright Justin Weinger - All Rights Reserved Disclaimer: The above is a matter of opinion provided for general information purposes only and is not intended as investment advice. Information and analysis above are derived from sources and utilising methods believed to be reliable, but we cannot accept responsibility for any losses you may incur as a result of this analysis. Individuals should consult with their personal financial advisors.
© 2005-2022 http://www.MarketOracle.co.uk - The Market Oracle is a FREE Daily Financial Markets Analysis & Forecasting online publication.


