


Is This The Start Of The Next Stocks Bear Market?
Stock-Markets / Stock Markets 2019 Aug 05, 2019 - 02:48 AM GMTBy: Chris_Vermeulen

 Over the past few days, we’ve received hundreds of emails from our followers and members asking if this is the big breakdown that everyone has been expecting in the markets. Yes, we’ve warned that it will likely happen before the end of 2019, but we’ve also been very clear that we believe an August 19, 2019 price peak will setup this move and our recent research suggest the NQ will rally to levels above 8200 before this peak in the US market sets up. So, in order to help our members and followers understand what we believe is actually happening in the markets, we’ve put together this research post to help everyone better prepare for the next few weeks and months.
First things first, the foundation of Fibonacci price theory is that price will always attempt to seek out new price highs or new price lows – ALWAYS. Many of the US major indexes have recently established new price highs in early July 2019. Think of this as a fundamental element in price structure when attempting to apply Fibonacci price theory.
When any chart establishes a new price high (a high price that is above the previous rotational peak level in price), the trend is established as BULLISH and we would immediately expect, at some future time, that price will rotate lower attempting to validate that new price high or attempt to reach a new price low. At certain times, external news can create “price over-reaction” events within the scope of price volatility. I’m certain many of you have experienced these types of expanded price ranges that turn into a “wash-out” type of wide-range rotations in the markets.
The combination of the US Fed and the US/China trade talk failures, as well as the rally in Gold, Silver and the US Dollar, are all acting to create a hyper-active rotation in the markets with larger volatility.
We suggest that everyone read these earlier research posts to better understand what is really happening in the markets right now :
July 30, 2019: August 19 Market Top Prediction
July 31, 2019: US Fed is rattling the global markets – Part II
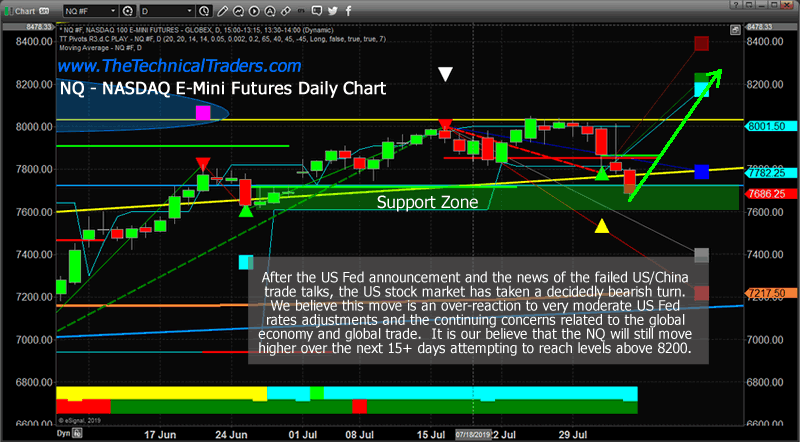
It is our opinion that the US Fed announcement followed immediately by the US/China trade talk failure created a “hyper-active” price rotation event that will likely turn into a short-term buying opportunity. Our Adaptive Dynamic Learning (ADL) predictive modeling system is suggesting the NQ will attempt to target levels above 8200 before the August 19, 2019 peak sets up. Therefore, it is still our belief that the markets are setting up a unique “price anomaly” with this current downside price rotation and that a move higher is in the works before the bigger downside price rotation actually begins.
This Daily NQ chart highlights the support level near 7600 that was set up by the June 2019 price rotation. Yes, the price has moved lower into this zone, but we believe this zone will act as a moderate support level and that price will rotate higher early in the week of August 5, 2019.
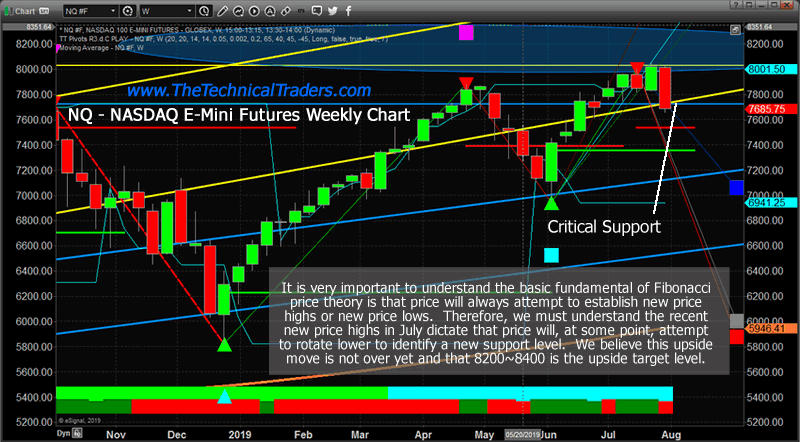
This Weekly NQ chart highlights our Fibonacci price modeling system and shows the “Critical Support” level from the October 2018 highs as well as the Bullish/Bearish trigger levels (the RED/GREEN lines near the right edge of the chart) that constitute confirmed price rotations. At this time, the current BEARISH trigger levels are near 7540 and the NQ is still 140 points above this level.
NEXT TRENDS FOR GOLD, SILVER, MINERS, AND S&P 500
In early June I posted a detailed video explaining in showing the bottoming formation and gold and where to spot the breakout level, I also talked about crude oil reaching it upside target after a double bottom, and I called short term top in the SP 500 index. This was one of my premarket videos for members it gives you a good taste of what you can expect each and every morning before the Opening Bell. Watch Video Here.
I then posted a detailed report talking about where the next bull and bear markets are and how to identify them. This report focused mainly on the SP 500 index and the gold miners index. My charts compared the 2008 market top and bear market along with the 2019 market prices today. See Comparison Charts Here.
On June 26th I posted that silver was likely to pause for a week or two before it took another run up on June 26. This played out perfectly as well and silver is now head up to our first key price target of $17. See Silver Price Cycle and Analysis.
More recently on July 16th, I warned that the next financial crisis (bear market) was scary close, possibly just a couple weeks away. The charts I posted will make you really start to worry. See Scary Bear Market Setup Charts.
CONCLUDING THOUGHTS:
In short, you should be starting to get a feel of where stocks are headed along with precious metals for the next 8-24 months. The next step is knowing when and what to buy and sell as these turning points take place, and this is the hard part. If you want someone to guide you through the next 12-24 months complete with detailed market analysis and trade alerts (entry, targets and exit price levels) join my ETF Trading Newsletter.
Be prepared for these incredible price swings before they happen and learn how you can identify and trade these fantastic trading opportunities in 2019, 2020, and beyond with our Wealth Building & Global Financial Reset Newsletter. You won’t want to miss this big move, folks. As you can see from our research, everything has been setting up for this move for many months – most traders/investors have simply not been looking for it.
Join me with a 1 or 2-year subscription to lock in the lowest rate possible and ride my coattails as I navigate these financial market and build wealth while others lose nearly everything they own during the next financial crisis.
As a technical analysis and trader since 1997, I have been through a few bull/bear market cycles. I believe I have a good pulse on the market and timing key turning points for both short-term swing trading and long-term investment capital. The opportunities are massive/life-changing if handled properly.
FREE GOLD & SILVER WITH MEMBERSHIPS
So kill two birds with one stone and subscribe for two years to get your FREE PRECIOUS METAL and get enough trades to profit through the next metals bull market and financial crisis!
Chris Vermeulen
www.TheTechnicalTraders.com
Chris Vermeulen has been involved in the markets since 1997 and is the founder of Technical Traders Ltd. He is an internationally recognized technical analyst, trader, and is the author of the book: 7 Steps to Win With Logic
Through years of research, trading and helping individual traders around the world. He learned that many traders have great trading ideas, but they lack one thing, they struggle to execute trades in a systematic way for consistent results. Chris helps educate traders with a three-hour video course that can change your trading results for the better.
His mission is to help his clients boost their trading performance while reducing market exposure and portfolio volatility.
He is a regular speaker on HoweStreet.com, and the FinancialSurvivorNetwork radio shows. Chris was also featured on the cover of AmalgaTrader Magazine, and contributes articles to several leading financial hubs like MarketOracle.co.uk
Disclaimer: Nothing in this report should be construed as a solicitation to buy or sell any securities mentioned. Technical Traders Ltd., its owners and the author of this report are not registered broker-dealers or financial advisors. Before investing in any securities, you should consult with your financial advisor and a registered broker-dealer. Never make an investment based solely on what you read in an online or printed report, including this report, especially if the investment involves a small, thinly-traded company that isn’t well known. Technical Traders Ltd. and the author of this report has been paid by Cardiff Energy Corp. In addition, the author owns shares of Cardiff Energy Corp. and would also benefit from volume and price appreciation of its stock. The information provided here within should not be construed as a financial analysis but rather as an advertisement. The author’s views and opinions regarding the companies featured in reports are his own views and are based on information that he has researched independently and has received, which the author assumes to be reliable. Technical Traders Ltd. and the author of this report do not guarantee the accuracy, completeness, or usefulness of any content of this report, nor its fitness for any particular purpose. Lastly, the author does not guarantee that any of the companies mentioned in the reports will perform as expected, and any comparisons made to other companies may not be valid or come into effect.
Chris Vermeulen Archive |
© 2005-2022 http://www.MarketOracle.co.uk - The Market Oracle is a FREE Daily Financial Markets Analysis & Forecasting online publication.