


Stock Market Bearish Signs from the Fed, Economy, and Volume
Stock-Markets / Stock Markets 2019 Aug 01, 2019 - 04:42 PM GMTBy: Troy_Bombardia

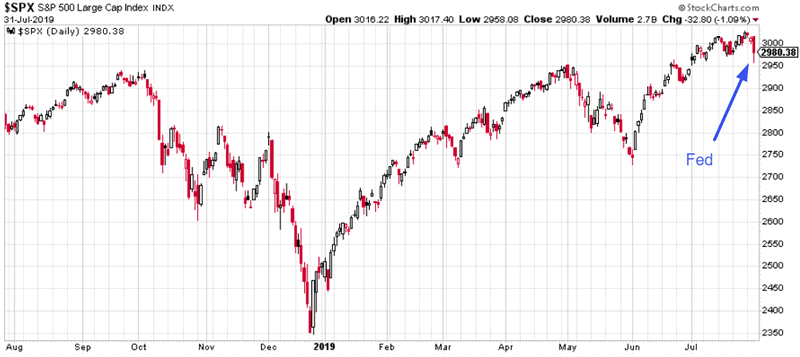
 Stocks fell Wednesday as the Fed cut interest rates. Today’s headlines:
- Rate cut and stocks
- The economic expansion cycle
- Manufacturing weakness
- Stock market’s volume
- U.S. Dollar breakout
Go here to understand our long term outlook. For reference, here’s the random probability of the U.S. stock market going up on any given day.

Rate cut
The Fed cut rates today for the first time in this economic expansion cycle. The Fed has cut rates many times over the past few decades, so if we just look at “what happens next to the S&P when the Fed cuts rates”, the answer is “anything can happen”.
That’s why when most traders look at how rate cuts impact the stock market, they usually apply a filter such as:
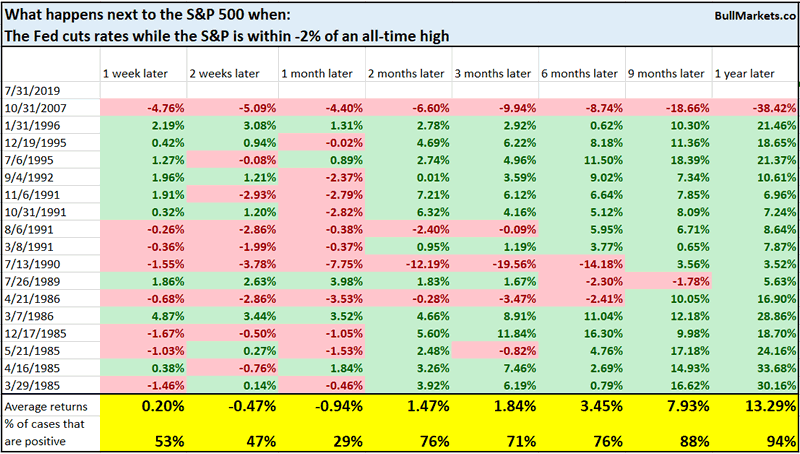
- Fed cuts rates while the S&P is within -2% of an all-time high
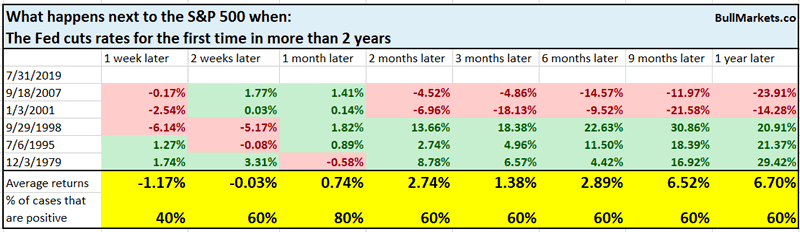
- Fed cuts rates for the first time in more than 2 years (because the first rate cut is often very different than the 5th rate cut in a rate cut cycle)
- Fed cuts rates while Unemployment is under 5% (i.e. late-cycle in the economic expansion)
Each of these filters makes sense, and I personally prefer the 3rd filter.
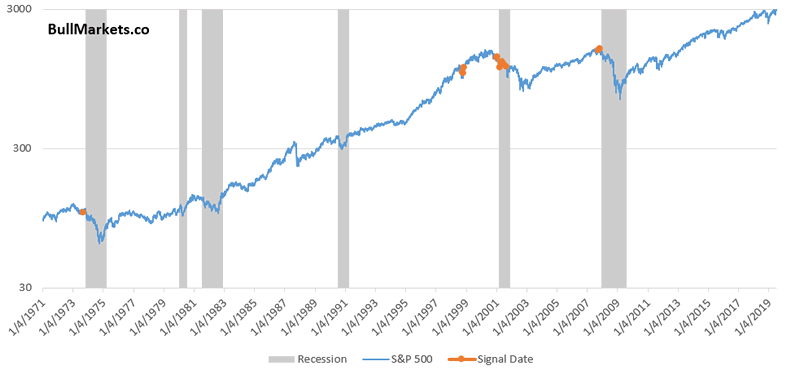
Here’s what happens next to the S&P when the Fed cuts rates while the S&P is within -2% of an all-time high, as we examined yesterday.
Here’s what happens next to the S&P when the Fed cuts rates for the first time in more than 2 years:
And finally, here’s what happens next to the S&P when the Fed cuts rates while unemployment is under 5%.
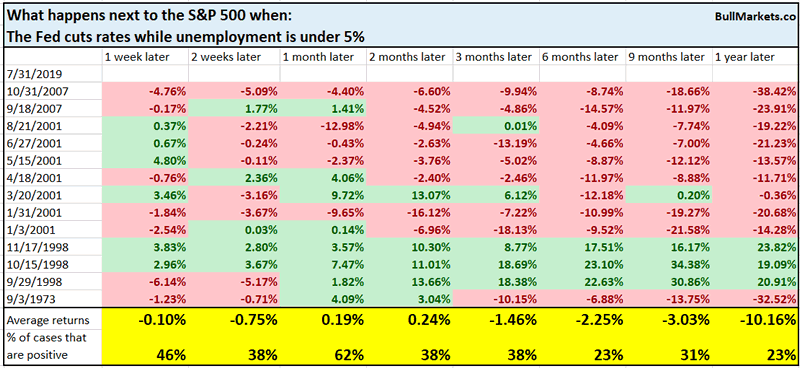
Overall, late-cycle rate cuts aren’t great for the stock market from a long term perspective. As the economic expansion ages, the long term downside risk for the economy is much higher than the upside.
Goldman Sachs Bull/Bear Indicator
Cycles are important. A signal (e.g. rate cut) that appears early in the economic expansion has a very different meaning from the same signal that appears late in the economic expansion.
A popular way of determining where we are in the economic expansion cycle is to use the Goldman Sachs Bull/Bear Indicator. This indicator uses 5 indicators to determine where we are in the bull market and economic expansion.
- ISM
- Yield curve
- Core inflation
- Unemployment
- Shiller P/E
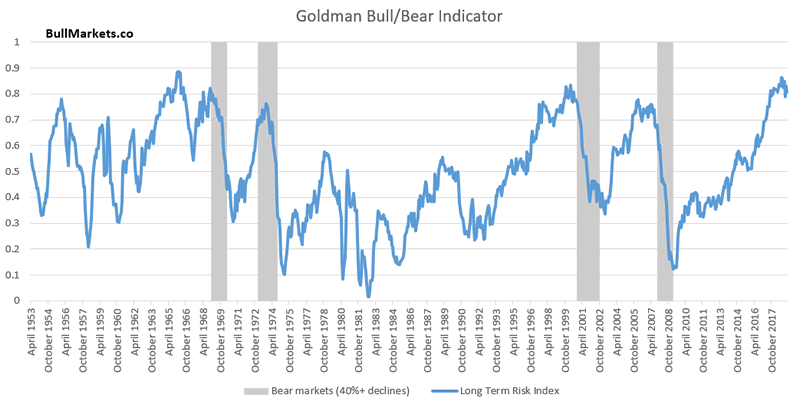
These long term indicators tell you little about what the stock market will do over the next week, month, or even year. However, it does give you an indication of what the stock market will do over the next 3-5 years.
The Goldman Bull/Bear indicator is very high right now (above 0.8). From 1953 – present, there have been 162 months with Bull/Bear readings above 0.7
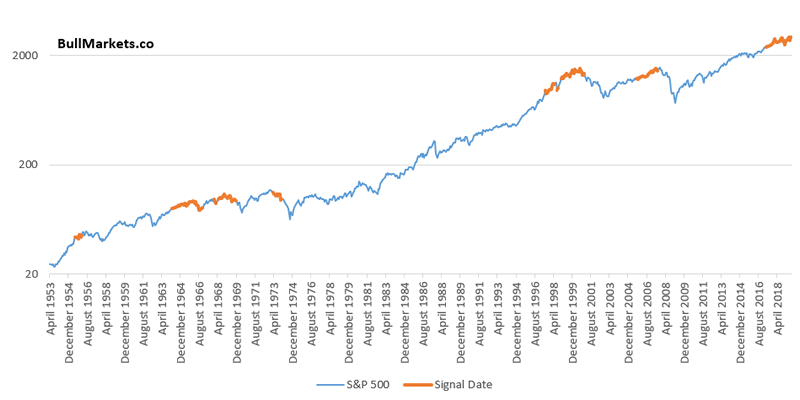
When this happened in the past, the S&P’s average gain over the next 2-5 years was negative.
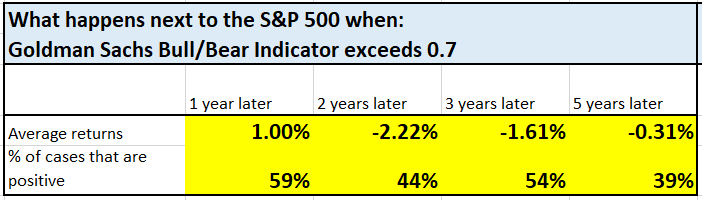
As I said, long term risk:reward does not favor bulls, even if the bull market does last another 1-2 years. Eventually there will be a big bear market
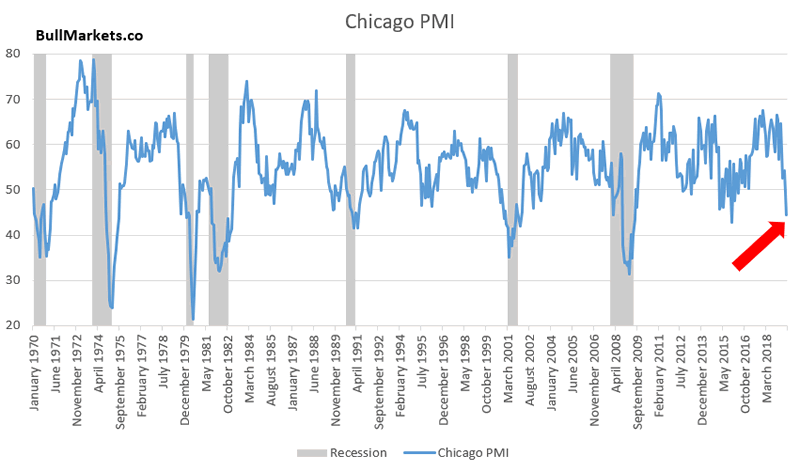
Manufacturing
Manufacturing data has been weak in recent months, and this is probably related to the ongoing trade war. Today’s Chicago PMI reading was extremely low. Except from a false signal in 2015, such low Chicago PMI readings always occurred during a recession.
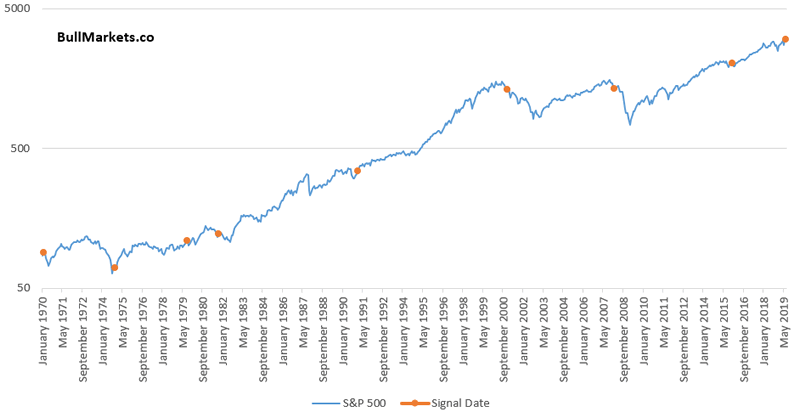
Here’s what happened next to the S&P when the Chicago PMI fell below 45.
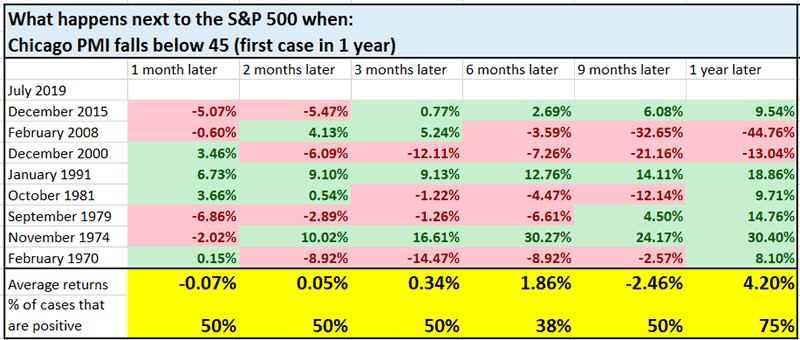
The stock market’s 6 month forward returns are more bearish than random. But as I’ve said over the past few months, manufacturing is just one sector of the economy. Right now, manufacturing and trade-related sectors are weak while other sectors of the economy are fine. Overall, the U.S. economy is not on the verge of a recession. You must look at the economic data holistically.
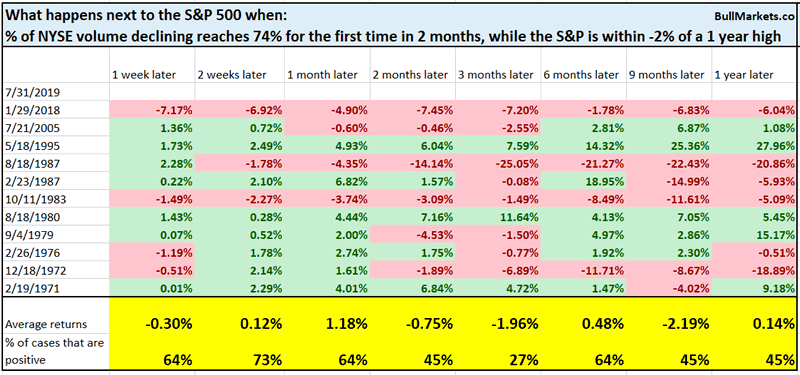
Volume
The stock market saw little volatility and little downside over the past 2 months. With the S&P falling more than -1% today for the first time in 7 weeks, 74% of volume on the NYSE was declining. DOWN volume is starting to rise after a 2 month slump.
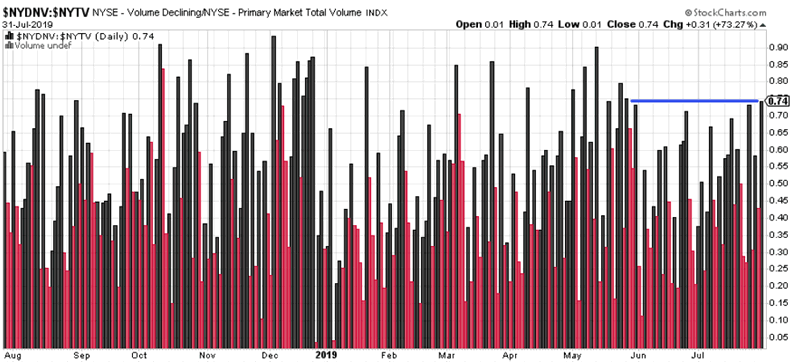
In the past, this was mostly bearish for the S&P over the next 3 months.
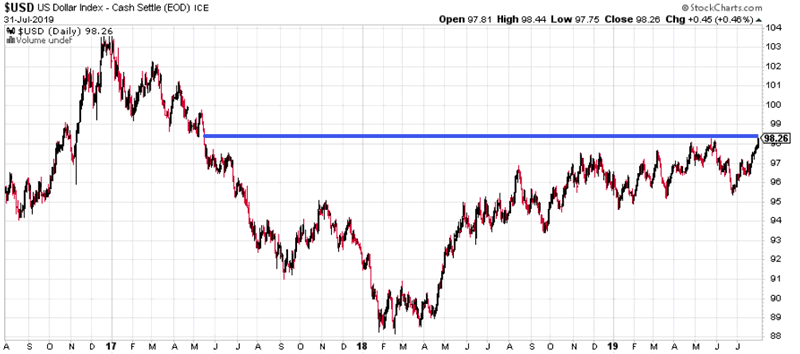
USD
And lastly, the U.S. Dollar Index has broken out to the highest level since 2017.

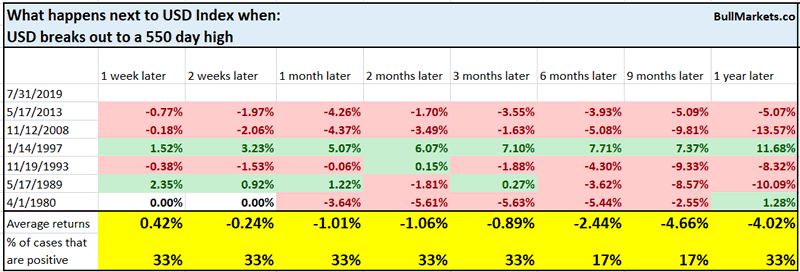
In the past, such breakouts were bearish for the U.S. Dollar…
… and bullish for gold 3 months later.
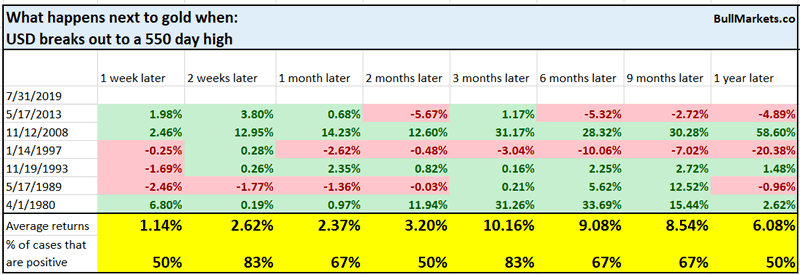
Moreover, this was not consistently bearish for stocks.
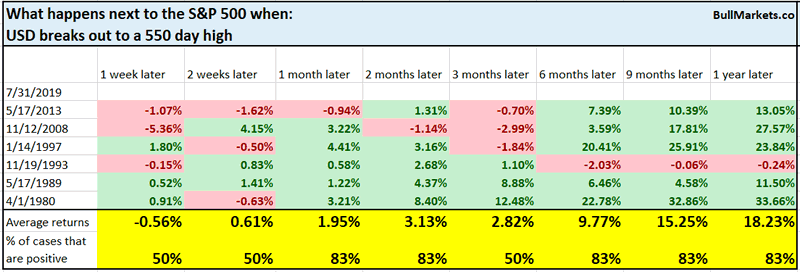
*Sample size is a little small.
We don’t use our discretionary outlook for trading. We use our quantitative trading models because they are end-to-end systems that tell you how to trade ALL THE TIME, even when our discretionary outlook is mixed. Members can see our model’s latest trades here updated in real-time.
Conclusion
Here is our discretionary market outlook:
- Long term: risk:reward is not bullish. In a most optimistic scenario, the bull market probably has 1 year left.
- Medium term (next 6-9 months): most market studies lean bullish.
- Short term (next 1-3 months) market studies lean bearish.
- We focus on the medium-long term.
Click here for more market analysis
By Troy Bombardia
I’m Troy Bombardia, the author behind BullMarkets.co. I used to run a hedge fund, but closed it due to a major health scare. I am now enjoying life and simply investing/trading my own account. I focus on long term performance and ignore short term performance.
Copyright 2019 © Troy Bombardia - All Rights Reserved
Disclaimer: The above is a matter of opinion provided for general information purposes only and is not intended as investment advice. Information and analysis above are derived from sources and utilising methods believed to be reliable, but we cannot accept responsibility for any losses you may incur as a result of this analysis. Individuals should consult with their personal financial advisors.
Troy Bombardia Archive |
© 2005-2022 http://www.MarketOracle.co.uk - The Market Oracle is a FREE Daily Financial Markets Analysis & Forecasting online publication.