


Is the Stock Market About to Crash or Soar?
Stock-Markets / Stock Markets 2019 Jul 09, 2019 - 06:04 AM GMTBy: Troy_Bombardia

 I’ve noticed an interesting development recently. Traders and investors are mostly split into 2 camps: those who are extremely bullish and think that December 2018 marked a cyclical bottom, and those who are extremely bearish and think that stocks will crash.
I think a middle ground scenario is more likely – this is just a normal rally towards the end of a bull market. A massive breakaway rally that will last years is unlikely, but neither is an imminent crash.
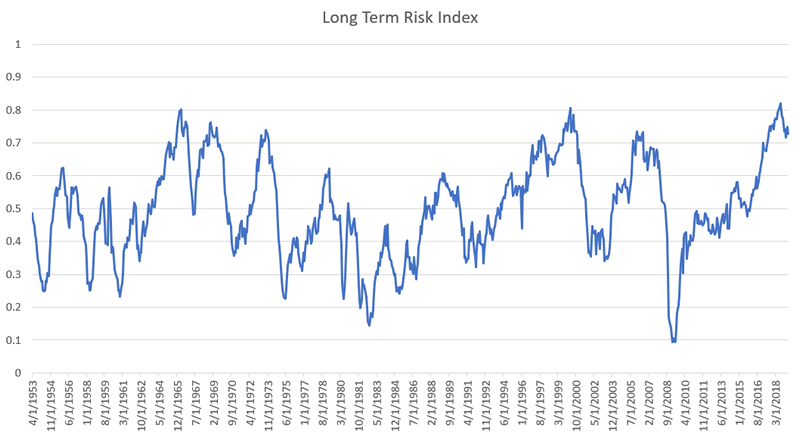
- Fundamentals (long term): no significant U.S. macro deterioration, but the long term risk:reward doesn’t favor bulls.
- Technicals (medium term): mostly bullish
- Technicals (short term): mixed
Let’s begin with technicals because most traders prefer technical analysis over fundamental analysis.
Technicals: Medium Term
*For reference, here’s the random probability of the U.S. stock market going up on any given day, week, or month.

Although the bull market is certainly late-cycle, the stock market’s medium term (next 6-9 months) leans bullish.
The 2nd half of 2019 vs. the first half
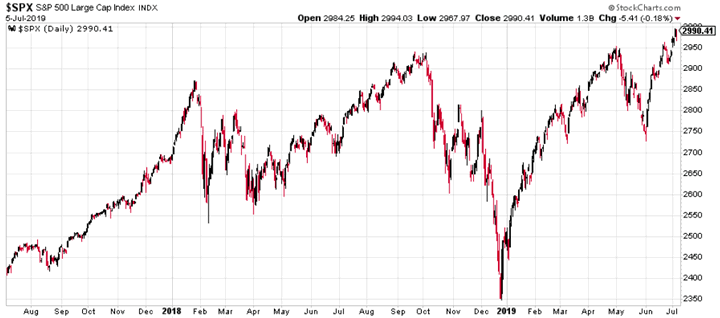
The S&P rallied more than 15% in the first half of 2019. After being stuck in a range since January 2018, it’s easy to assume that the stock market will breakout on the upside with massive gains ahead. This is unlikely. A more likely scenario is that the stock market will continue to rally, but with more corrections ahead.
Aside from today, there are 9 other historical cases in which the S&P rallied more than 15% in the first half of the year. 7 of these 9 historical cases saw more choppiness in the 2nd half of the year, often resulting in a -10% correction.
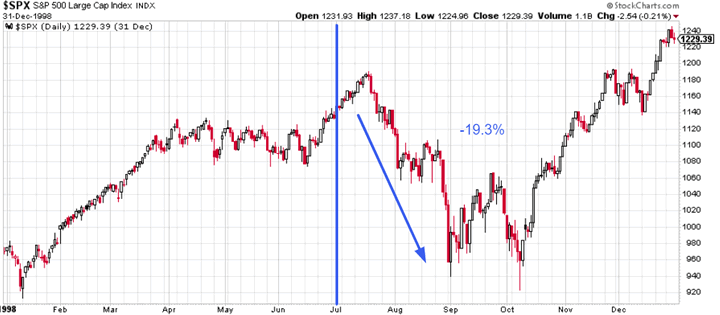
Here’s 1998. There was a -19% correction in the 2nd half of the year.
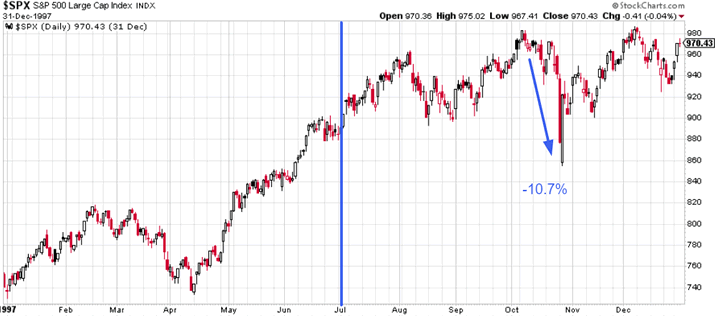
Here’s 1997. There was a -10% correction in the 2nd half of the year.
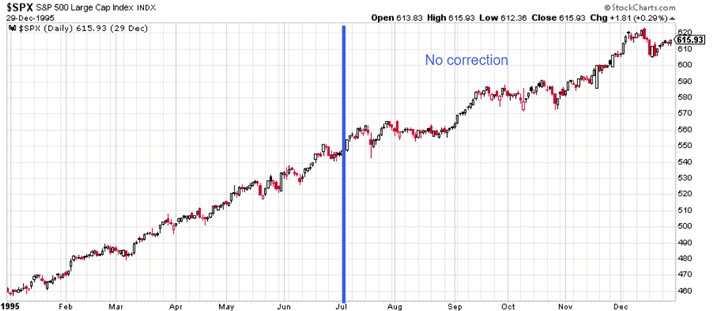
Here’s 1995. There was no correction in the 2nd half of the year.
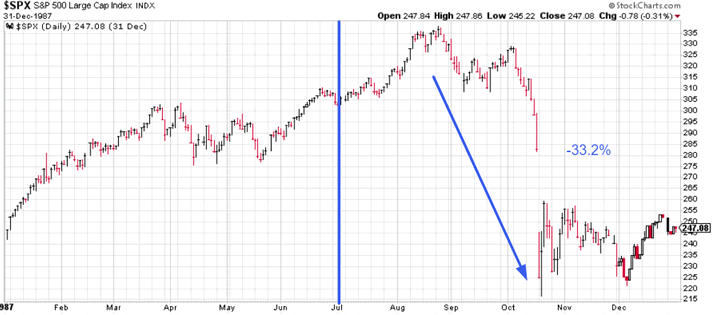
Here’s 1987. There was a -33% correction in the 2nd half of the year.
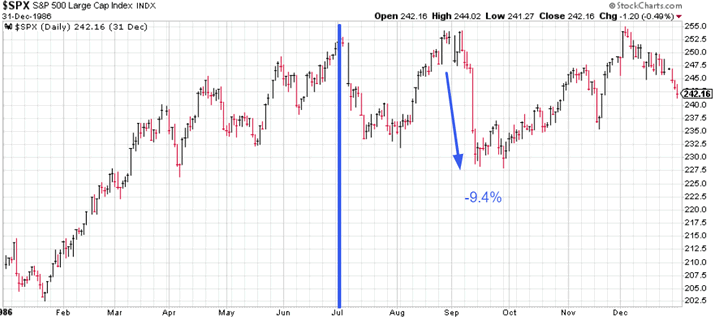
Here’s 1986. There was a -9% correction in the 2nd half of the year.
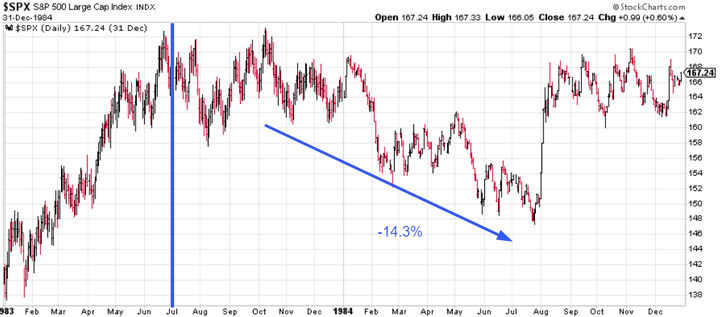
Here’s 1983. The stock market began a -14% correction in the 2nd half of the year.
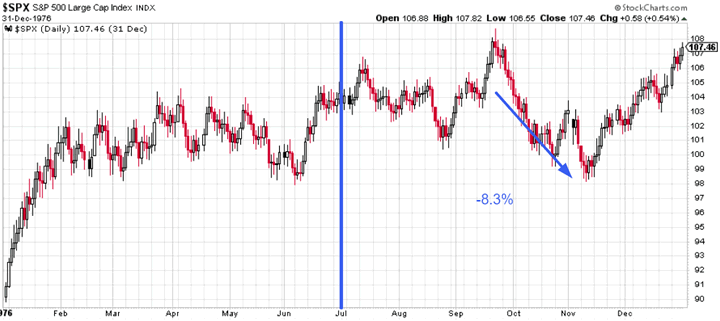
Here’s 1976. There was a -8% correction in the 2nd half of the year.
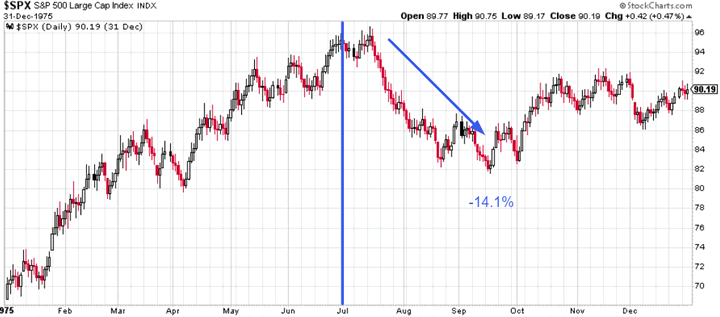
Here’s 1975. There was a -14% correction in the 2nd half of the year.
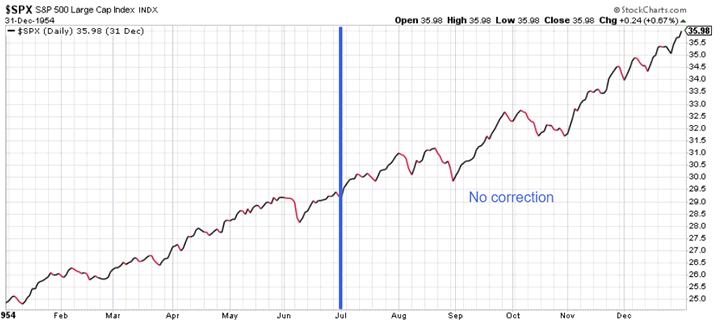
Here’s 1954. There was no correction in the 2nd half of the year.
To summarize:
- 7 of these 9 historical cases had a 8%+ correction in the 2nd half of the year.
- Only 1995 and 1954 did not have a decent correction in the 2nd half of the year.
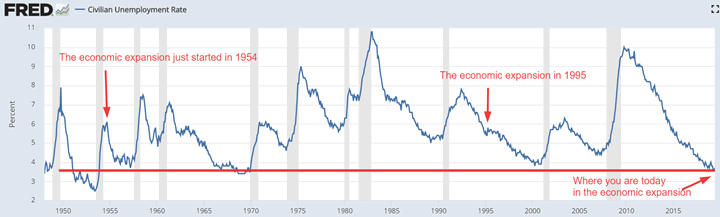
The present day is not similar to 1995 or 1954. Those 2 historical cases occurred in the middle of an economic expansion, when there was much more room for the economy to expand. Today, the economy is towards the end of an expansion and there is much less room to grow. As the economic expansion and bull market ages, it tends to become more choppy.
Quick recovery
With that being said, the stock market probably has more gains ahead over the next 6-12 months, even if the rally becomes more choppy.
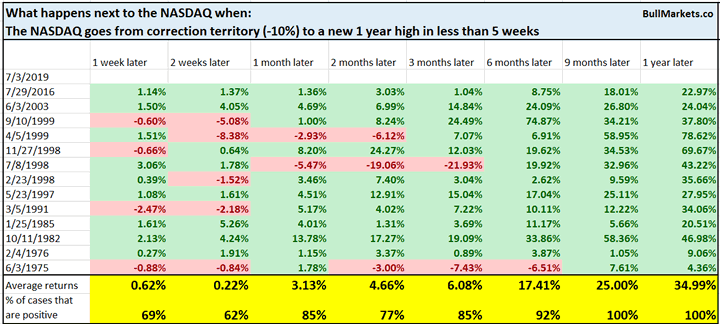
The stock market has made a quick recovery from its correction in May. The NASDAQ made a new high this week, after being in correction territory (-10% from a 1 year high) less than 5 weeks ago.
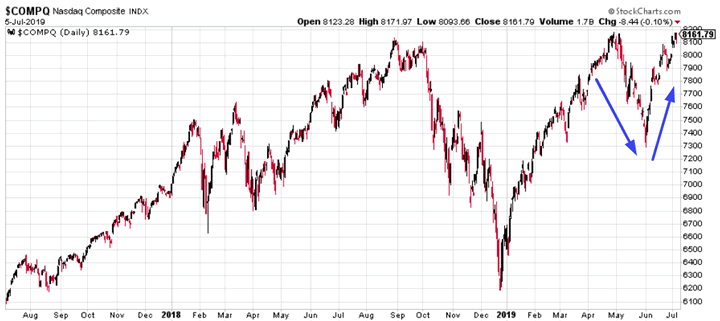
Historical cases were almost exclusively bullish for the NASDAQ (and S&P) over the next 6-12 months. Quick recoveries are driven by many investors who want to buy the dip.

Sentiment
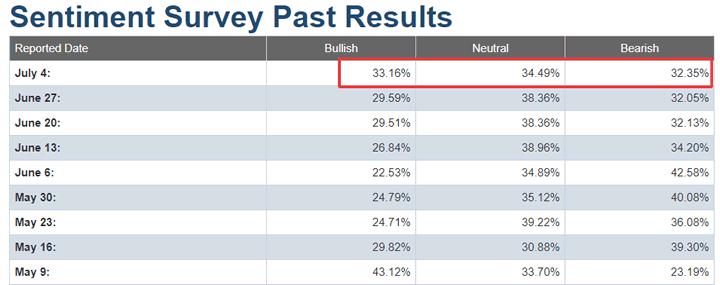
Sentiment is finally improving. AAII Bulls has exceeded 30% for the first time in 7 weeks.
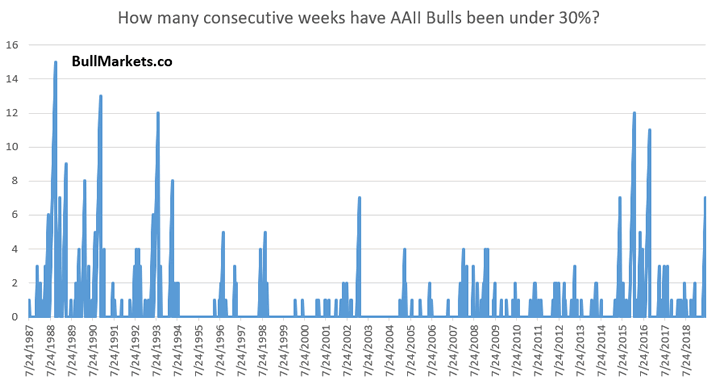
Long streaks in which AAII Bulls are under 30% usually occur during bull markets. This is counterintuitive: you’d think that long pessimistic streaks occur in bear markets (e.g. 2000-2002, 2007-2009). But bear markets frequently see big spikes in optimism when investors mistake the big bear market rallies for the start of a bull market.
Here’s what happened next to the S&P when AAII Bulls exceeded 30% for the first time in at least 7 weeks.
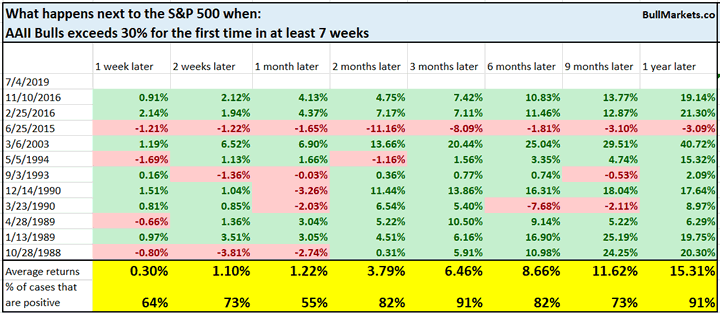
The S&P’s forward returns are mostly bullish 3 months and 1 year later because these cases all occurred in a bull market.
Breadth
More than 75% of S&P stocks are now above their 200 day moving average for the first time since early-2018.
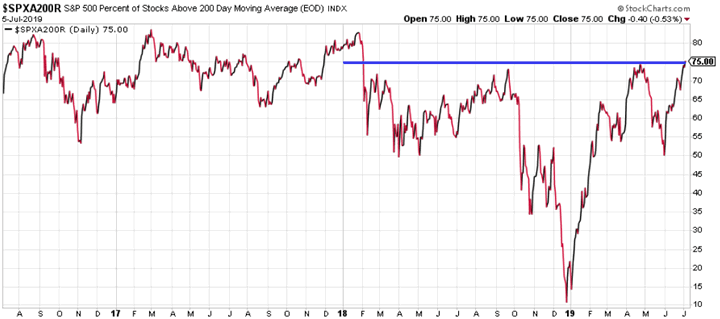
This improvement in breadth broke a long streak in which fewer than 75% of S&P stocks were above their 200 dma.
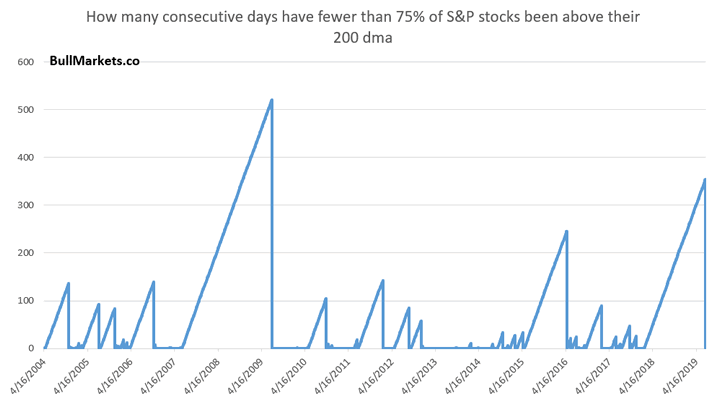
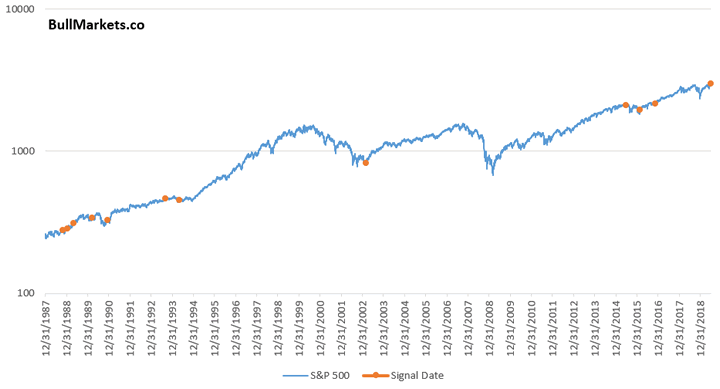
The only other comparable streak occurred at the start of this bull market in 2009. But n=1 doesn’t mean anything. So let’s relax the parameters to increase the sample size. Here are all the cases in which more than 75% of S&P stocks are above their 200 dma for the first time in more than 100 days.
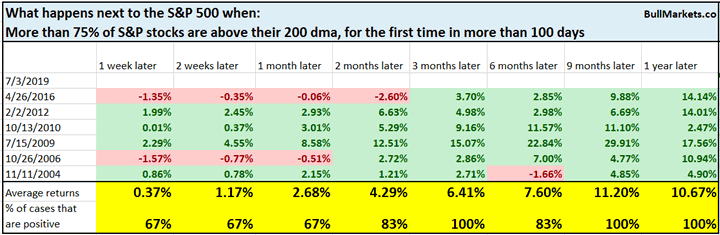
Mostly bullish for stocks 3-12 months later.
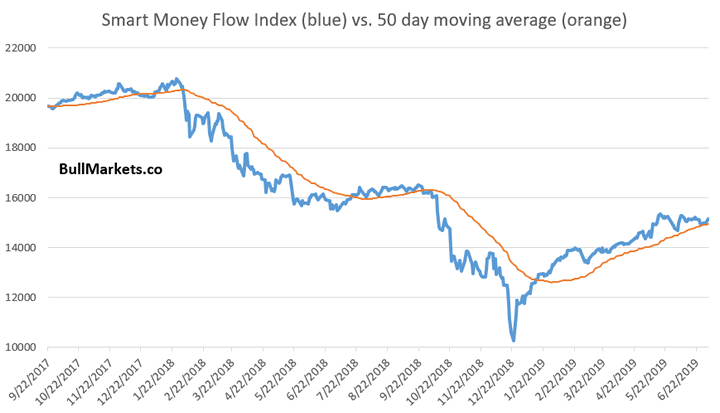
Smart Money Flow Index
The Smart Money Flow Index is calculated by adding the Dow’s change in the last hour of each day and subtracting the Dow’s change in the first 30 minutes of each day. This index is based on the idea that “smart money” trades in the final hour of each trading day while the “dumb money” trades at the start of each day.
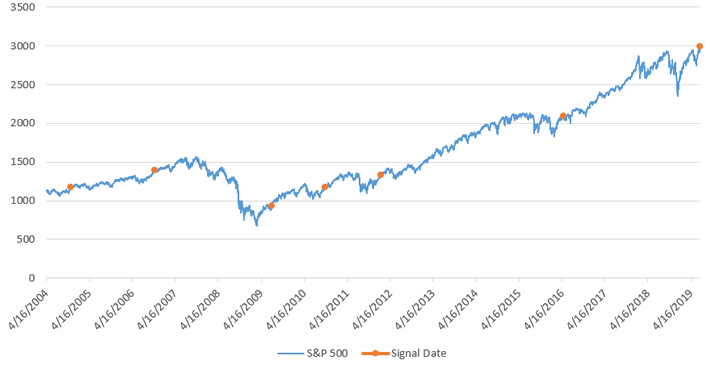
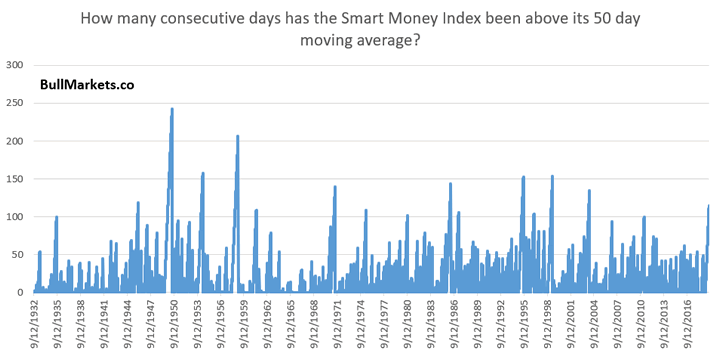
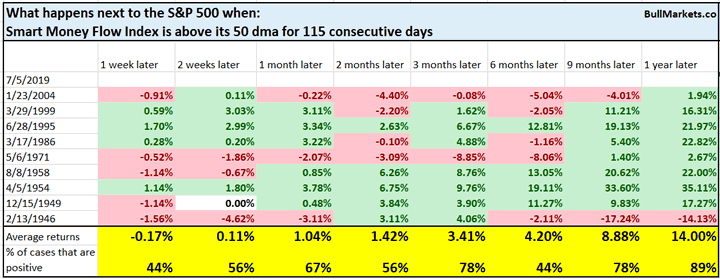
The Smart Money Flow Index has been above its 50 day moving average (intermediate term trend) for 115 consecutive days. This is a long streak.
Similar streaks were mostly bullish for the S&P 1 year later.
Momentum Divergence
A lot commentators see the following monthly RSI divergence, and think that a crash is impending because there was an RSI divergence before 2000 and 2007!
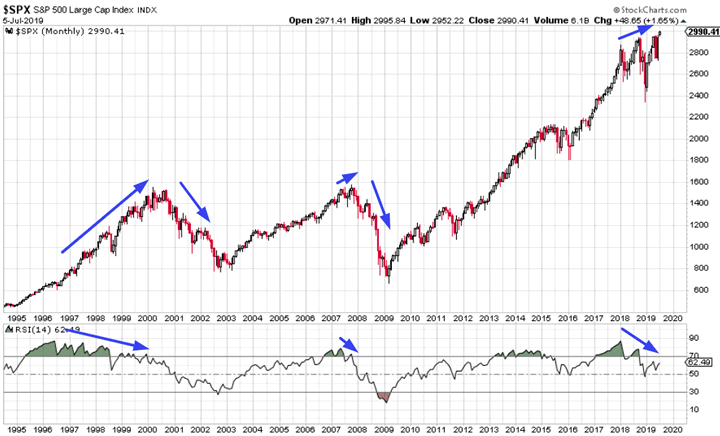
As I explained on Wednesday, every major top (2000, 2007, etc) has a monthly RSI divergence, but not every monthly RSI divergence leads to a major top. More often than not, RSI divergences don’t mean much.
The following chart illustrates every single case in which the S&P is at a 3 year high, but monthly RSI is not at a 3 year high (i.e. divergence).
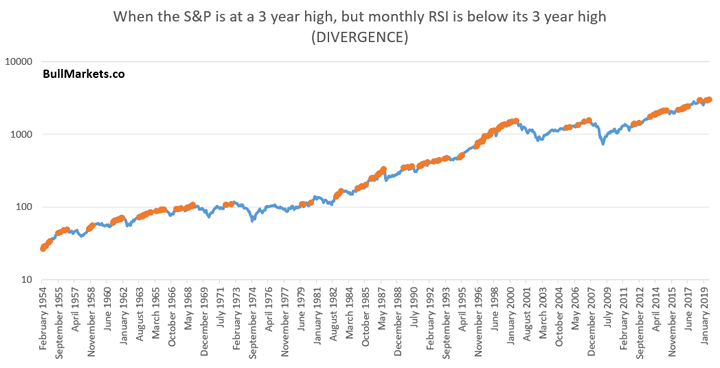
A monthly RSI divergence occurs when:
- The S&P rallies extremely hard, setting a high for RSI.
- Then the S&P rallies in a more choppy manner, “washing out” RSI and making new highs while RSI does not make new highs.
All major tops have an RSI divergence because the pace of the stock market’s rally tends to slow down before it tops. But not every rally that slows down leads to a major top. Sometimes the rally slows down (RSI washes out), and then pushes higher again.
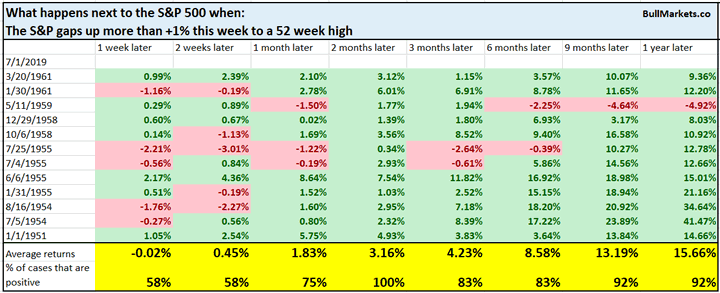
Gaps
And lastly, the S&P gapped up more than +1% this week to a 52 week high.
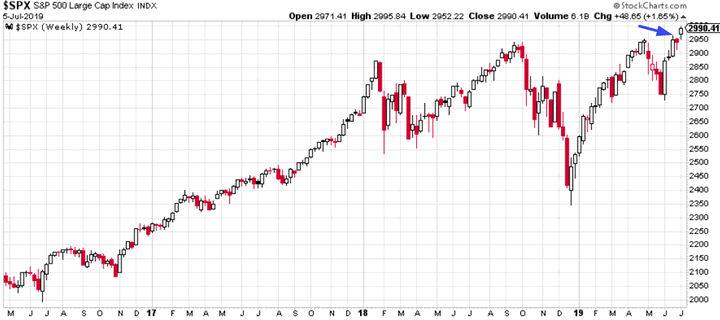
While these gaps may be filled in the short term, they typically lead to more gains over the next 2 months.
Fundamentals: Long Term
The stock market and the economy move in the same direction in the long run, which is why we focus on macro.
Most U.S. leading economic indicators are decent right now, which suggests that a recession is not imminent. The main weak points revolve around the yield curve, housing, and manufacturing/trade. Other sectors point to continued growth. Let’s recap some of the leading macro indicators we covered:
Yield curve
I’ve explained why the next 6-12 months will probably see more gains for the stock market. But I do not think that December 2018 marked a long term cyclical bottom, to be followed by years of gains.
The yield curve is not perfect, but it does give you a sense of long term risk:reward.
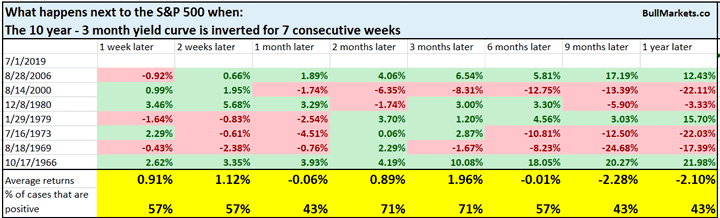
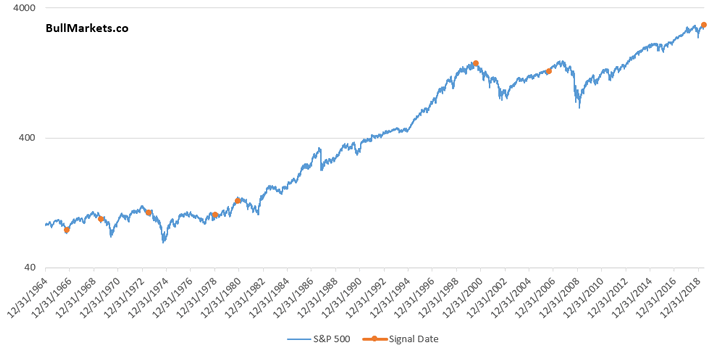
And right now, the 10 year – 3 month yield curve has been inverted for 7 consecutive weeks.
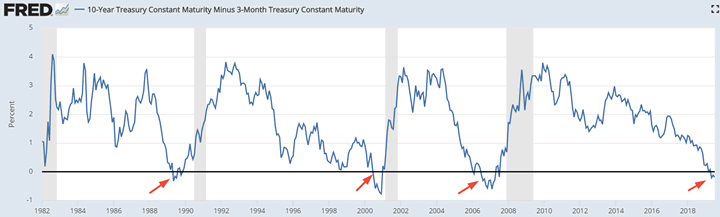
In the past, this usually occurred:
- When a bear market or recession had already began.
- Within 1+ year of a bull market’s top.
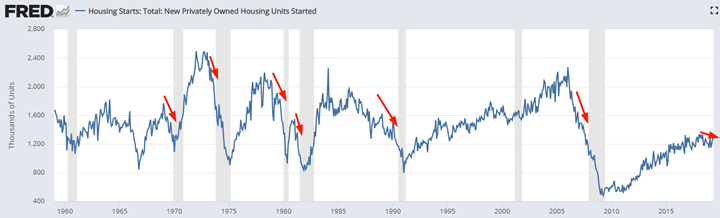
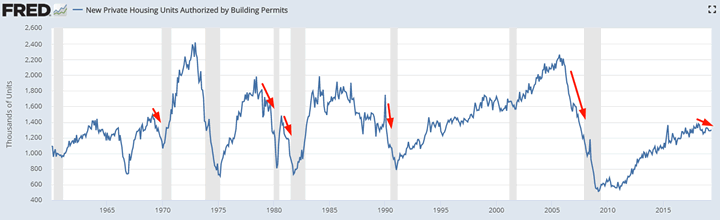
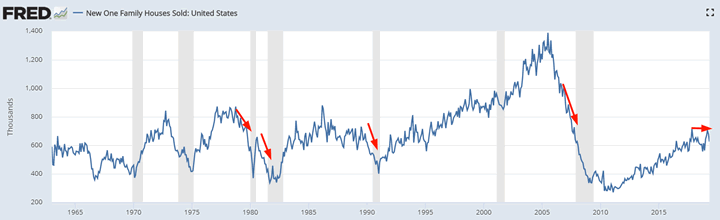
Housing is a slight negative factor, but could improve
Housing – a key leading sector for the economy – remains weak. Housing Starts and Building Permits are trending downwards while New Home Sales is trending sideways. In the past, these 3 indicators trended downwards before recessions and bear markets began.
Manufacturing and trade-related sectors are weak
The latest reading for ISM PMI fell below 52. It’s easy to assume that this is bearish for the stock market. Afterall, “how can the stock market keep going up when the economy is slowing down?”
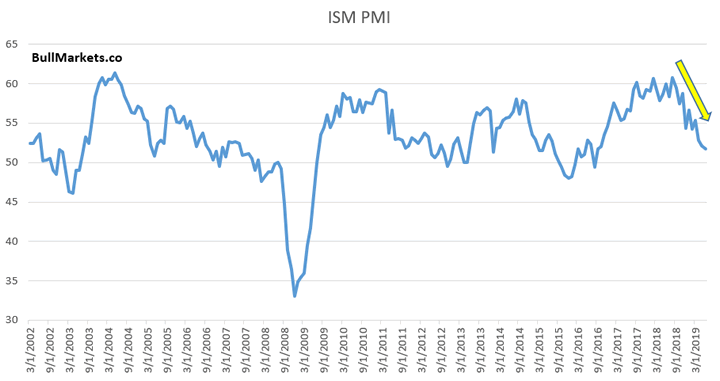
While a lot of manufacturing related economic indicators have been disappointing recently, manufacturing is not a big part of the U.S. economy. The U.S. is not manufacturing-centric like China or Germany.
Here’s what happened next to the S&P when the ISM PMI fell below 52
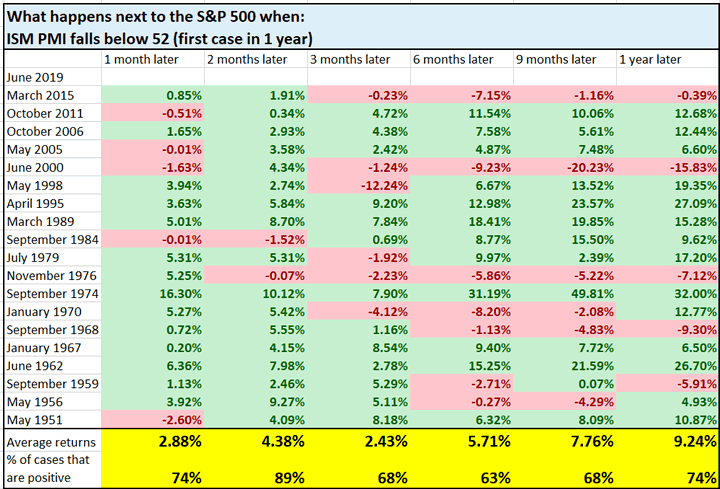
Mostly bullish 2 months later, and random after that. Now that we’ve covered the negative macro factors, let’s move onto the positive ones.
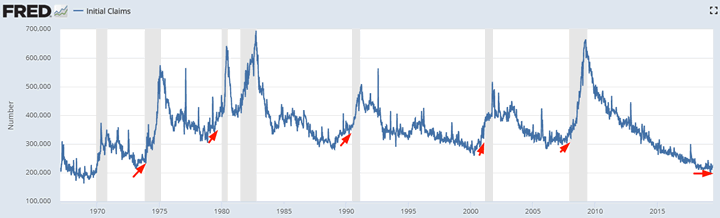
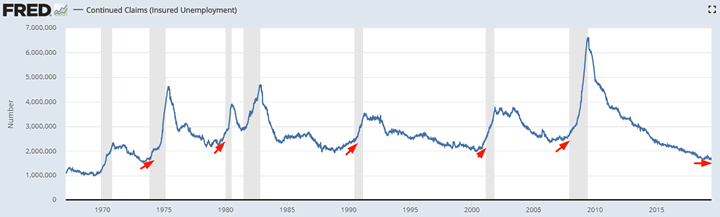
Labor market is still a positive factor
The labor market is still a positive factor for macro. Initial Claims and Continued Claims are trending sideways. In the past, these 2 leading indicators trended higher before bear markets and recessions began.

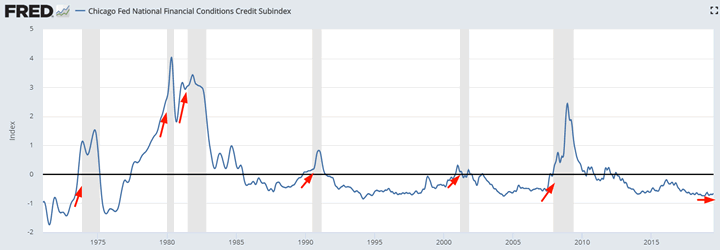
Financial conditions
Financial conditions remain very loose. In the past, financial conditions tightened before recessions and bear markets began.
Here’s the Chicago Fed’s Financial Conditions Credit Subindex
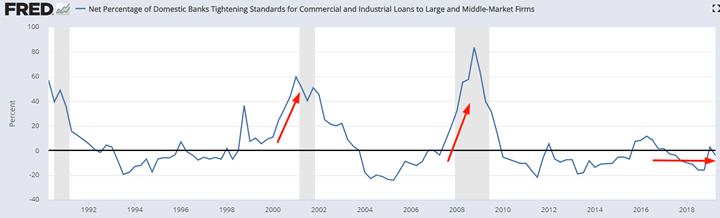
Here’s banks’ lending standards. Whereas lending standards remain loose today, they tightened significantly before the previous 2 bear markets and recessions.
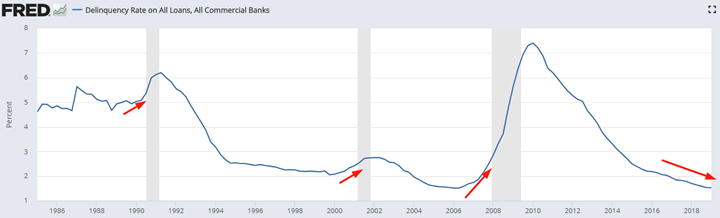
Delinquency Rates
Delinquency rates continue to trend downwards. In the past, this indicator trended upwards before recessions and bear markets began.
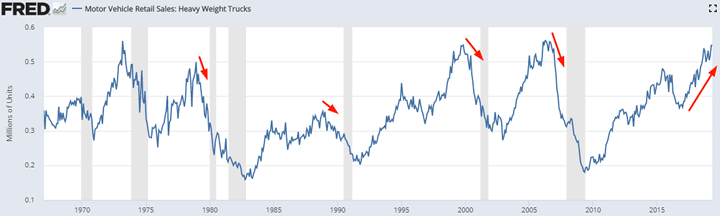
Heavy Truck Sales
Heavy Truck Sales is still trending upwards. In the past, Heavy Truck Sales trended downwards before recessions and bear markets began.
Largest divergence ever
I saw a popular tweet from @chigrl.
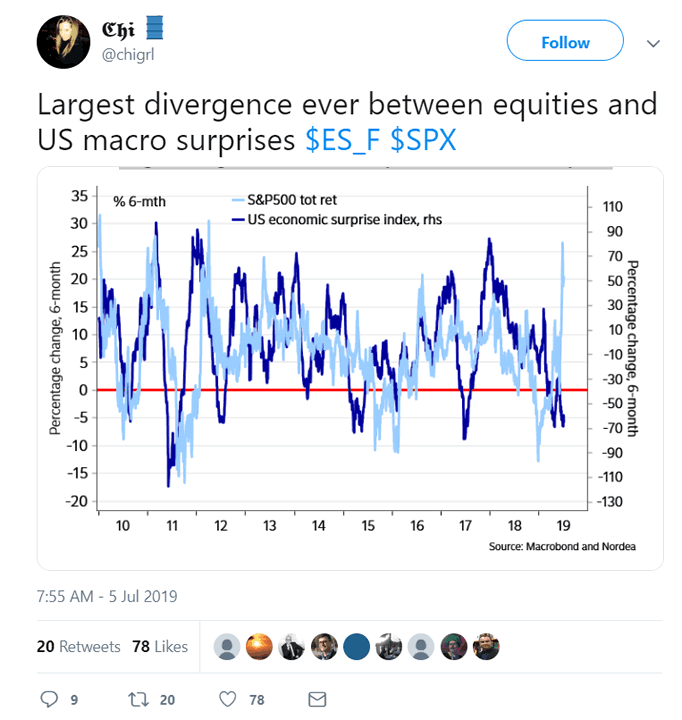
The above chart only goes from 2010-present. I’m usually skeptical of charts that show a limited amount of data, so I overlapped the entire Citigroup Economic Surprise Index (since 2003) against the S&P 500 Total Return Index’s 6 month % change.
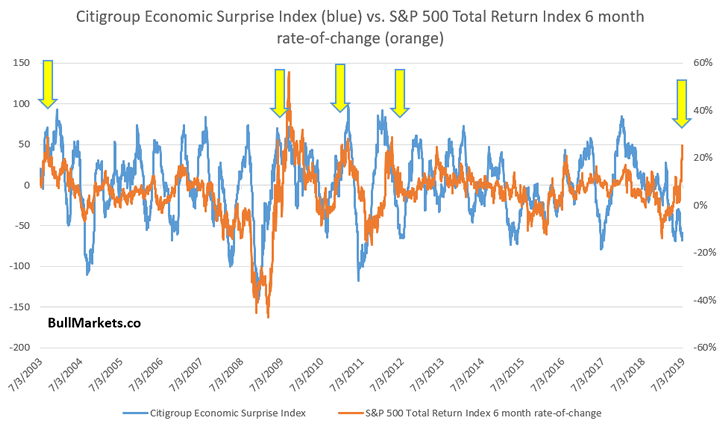
This is indeed one of the largest divergences ever. You can see that S&P rallies (yellow arrows) usually saw much higher Economic Surprise readings.
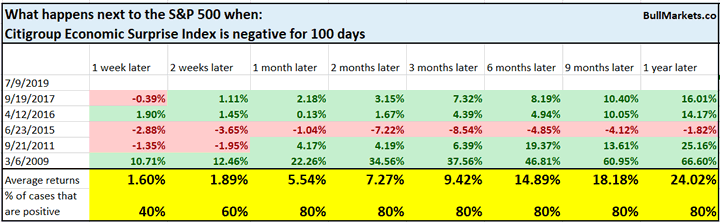
It’s hard to draw a conclusion from n=1 “largest divergence ever”. So instead, let’s just look at how long the Citigroup Economic Surprise Index has been negative. (This indicator is mean-reverting).
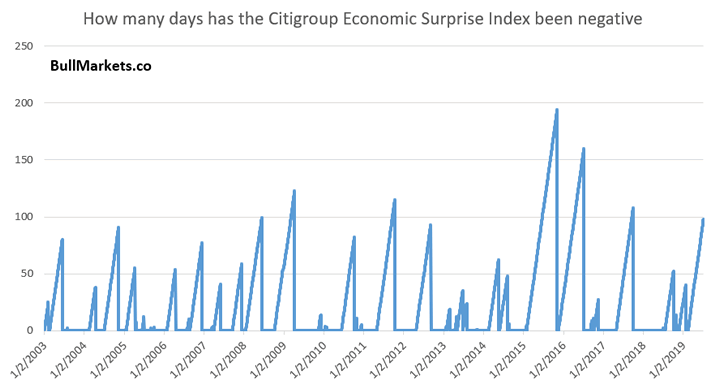
Similar long historical streaks were rare, but did not end up in a full-blown bear market. It’s easy to assume that whenever the S&P “diverges” from another indicator, the S&P is the dumb money that will reconnect.
Baltic Dry Index
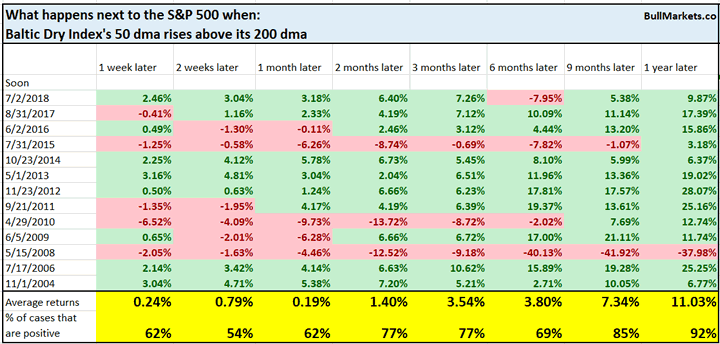
And lastly, the Baltic Dry Index’s 50 dma is about to cross above its 200 dma (uptrend). The Baltic Dry Index is a measure of global shipping.
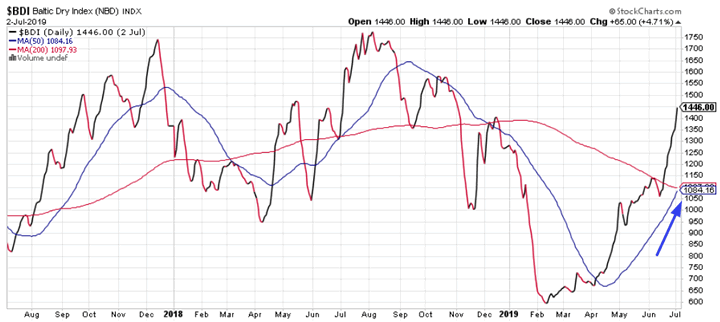
In the past, this was mostly bullish for the S&P 9-12 months later.
We don’t use our discretionary outlook for trading. We use our quantitative trading models because they are end-to-end systems that tell you how to trade ALL THE TIME, even when our discretionary outlook is mixed. Members can see our model’s latest trades here updated in real-time.
Conclusion
Here is our discretionary market outlook:
- Long term: risk:reward is not bullish. In a most optimistic scenario, the bull market probably has 1 year left.
- Medium term (next 6-9 months): most market studies are bullish.
- Short term (next 1-3 months) market studies are mixed.
- We focus on the medium-long term.
Goldman Sachs’ Bull/Bear Indicator demonstrates that risk:reward favors long term bears.
Click here for more market analysis
Here’s what happens next to the S&P when lumber rallies above its 50 week moving
By Troy Bombardia
I’m Troy Bombardia, the author behind BullMarkets.co. I used to run a hedge fund, but closed it due to a major health scare. I am now enjoying life and simply investing/trading my own account. I focus on long term performance and ignore short term performance.
Copyright 2019 © Troy Bombardia - All Rights Reserved
Disclaimer: The above is a matter of opinion provided for general information purposes only and is not intended as investment advice. Information and analysis above are derived from sources and utilising methods believed to be reliable, but we cannot accept responsibility for any losses you may incur as a result of this analysis. Individuals should consult with their personal financial advisors.
Troy Bombardia Archive |
© 2005-2022 http://www.MarketOracle.co.uk - The Market Oracle is a FREE Daily Financial Markets Analysis & Forecasting online publication.