Huge Gap between US Markets and International Trade
Stock-Markets / US Stock Markets Jul 08, 2019 - 08:24 AM GMTBy: Dan_Steinbock

 Globalization is not a concern to the Trump administration, which seeks to sustain high market valuations that are not supported by the fundamentals. As a result, a global recession in 2020 would not be the worst scenario.
Since the mid-1980s, the Baltic Dry Index (BDI) has been used as a barometer of international commodity trade. It is also seen as an economic indicator of future economic growth and production.
During the years of globalization, the Index heralded the peak of the oil prices and soared to a record high in May 2008 reaching 11,793 points. But as the financial crisis spread in the advanced West, the BDI plunged by 94% to 663 points, the lowest since 1986. That’s when marine shippers were moving dangerously close to the combined operating costs of vessels, fuel, and crews.
As China and other large emerging economies chose to support the ailing advanced economies amid the global crisis in fall 2008, the US, the EU and Japan pledged they would accelerate reforms in global governance. Moreover, the central banks of the major advanced economies launched massive fiscal stimulus packages and monetary easing.
As a result, the Index returned to 4,661 in 2009. However, as promises of reforms were ignored and stimulus policies expired, the BDI bottomed out at 1,043 in early 2011, amid the European sovereign debt crisis.
During the past years, advanced economies have sustained a semblance of stability by relying on historically ultra-low interest rates (while the US Federal Reserve did exit from normalization, it is now pondering a return to rate cuts) and massive injections of quantitative easing.
Stagnation, despite hyper-monetary policies
Yet, these huge shifts have not been reflected by the BDI, which continues to stagnate, as do the advanced economies.
Another turn for the worse followed with US protectionist moves. As long as the Trump administration engaged in protectionist rhetoric but avoided a trade war, the BDI climbed to almost 1,600. As Trump opted for the trade war, the Index fell to less than 700 in early 2019 – close to its historical low amid the 2008 crisis.
Recently, there has been much optimism about the “resurgence” of the Index as the trade truce has supported its rise back to over 1,700. Yet, this increase is predicated on the trade truce. Moreover, it is a level that the Index first reached already in 2000 and the mid-1990s.
Here’s the bottom line that should worry us all: Despite huge stimulus packages after the 2008 global crisis, a decade of massive monetary injections and record-low interest rates, there has been no corresponding pickup in world trade.
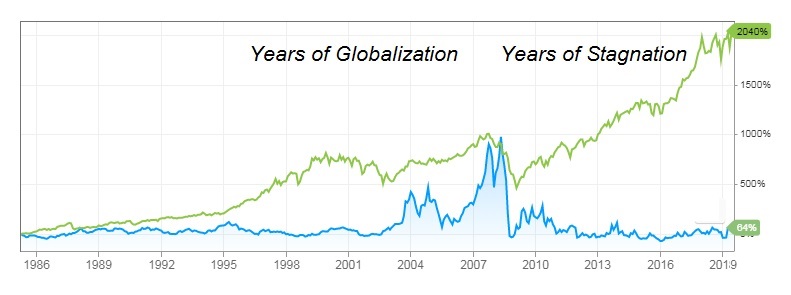
In contrast, the fate of the equities, as evidenced by the Dow Jones Industrial Average (DJIA), has been very different. In the past decade, the DJIA more than tripled from its crisis low of less than 8,000 to its peak of 26,966 in early 2018, before Trump launched his war path. Supported with the trade truce, it is now again close to its historical high at more than 26,900 (Figure).
Figure Years of Globalization, Years of Stagnation, 1985-2019

Source: Bloomberg; Baltic Dry Index; CNBC; Difference Group
Huge gap between US markets and international realities
Since the 1980s, international commodity trade, as proxied by the Baltic Dry Index, has increased by 64 percent. It remains today a tenth of its high in 2008. Meanwhile, US equities, as proxied by the Dow Jones Index, have increased by 2,040 percent. US equities have grown more than 30 times faster than international trade.
But why has the BDI not returned to its pre-crisis high? And why has it not climbed beyond that peak as the equity markets have done so triumphantly?
After all, in the past decade, world population has increased by some 1 billion people (more than three times the US population) and world GDP by almost $25 trillion (or the size of all 28 EU economies plus Japan together). Given presumably peaceful conditions, it is only fair to expect international trade would expand accordingly.
What is clear is that the current gap between US market highs and international economic realities is precipitating a global recession by 2020, given the current trends. And that is the benign – not the malignant – scenario. US market prices remain twice as high as their historical averages (in light of the cyclically-adjusted price-earnings ratio).
Worse, as US markets thrive whereas international fundamentals – including trade – stagnate, the gap between the two is paving way to a drastic market correction in the future that could prove far more disruptive and longer-lasting than the 2008 crisis.
Dr. Dan Steinbock is the founder of Difference Group and has served at the India, China and America Institute (US), Shanghai Institute for International Studies (China) and the EU Center (Singapore). For more, see http://www.differencegroup.net/
© 2019 Copyright Dan Steinbock - All Rights Reserved
Disclaimer: The above is a matter of opinion provided for general information purposes only and is not intended as investment advice. Information and analysis above are derived from sources and utilising methods believed to be reliable, but we cannot accept responsibility for any losses you may incur as a result of this analysis. Individuals should consult with their personal financial advisors.
Dan Steinbock Archive |
© 2005-2022 http://www.MarketOracle.co.uk - The Market Oracle is a FREE Daily Financial Markets Analysis & Forecasting online publication.


