


The Stock Market Has Gone Nowhere and Volume is Low. What’s Next
Stock-Markets / Stock Markets 2019 Jun 18, 2019 - 05:46 PM GMTBy: Troy_Bombardia

 The stock market has been trading within a very small range since last week, and volume has been notably low. Today’s headlines:
- Stock market’s small range
- Stock market’s low volume
- High stock:bond ratio
- The S&P’s long term correlations
- “A key manufacturing gauge just saw its biggest one month collapse in 18 years”
- Banks underperforming
Go here to understand our fundamentals-driven long term outlook. For reference, here’s the random probability of the U.S. stock market going up on any given day.

Small range
The stock market has gone nowhere each day since last Monday, with very small daily changes.
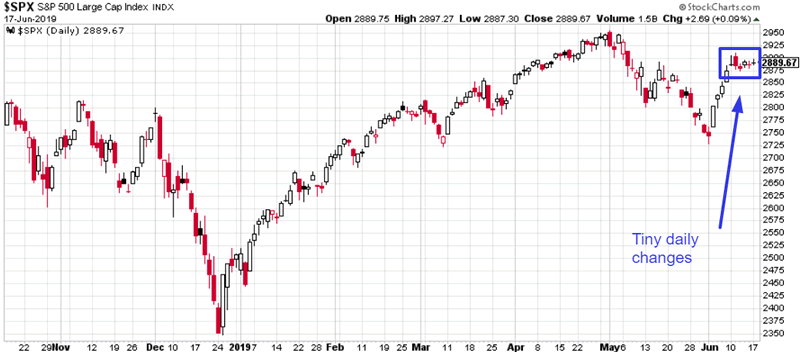
Such small daily movements tend to happen when a market is slowly grinding higher, such as in 2017. It doesn’t often happen when the market is still climbing out of a correction and VIX is elevated.
Here’s what happens next to the S&P when it goes up and down less than 0.5% on each of the past 6 days, while VIX is above 15.
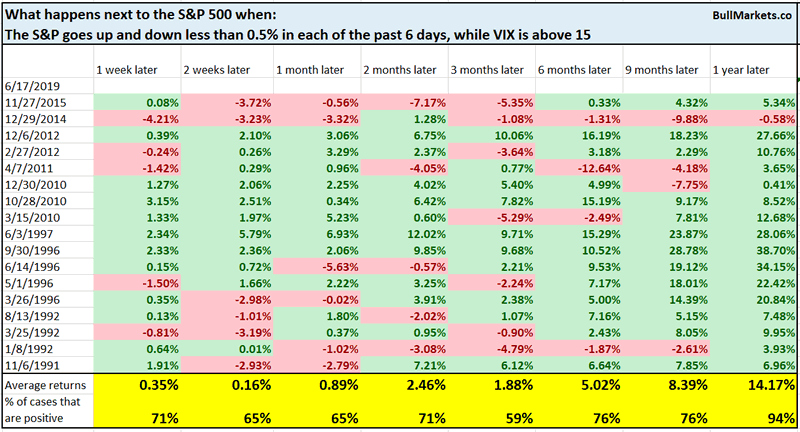
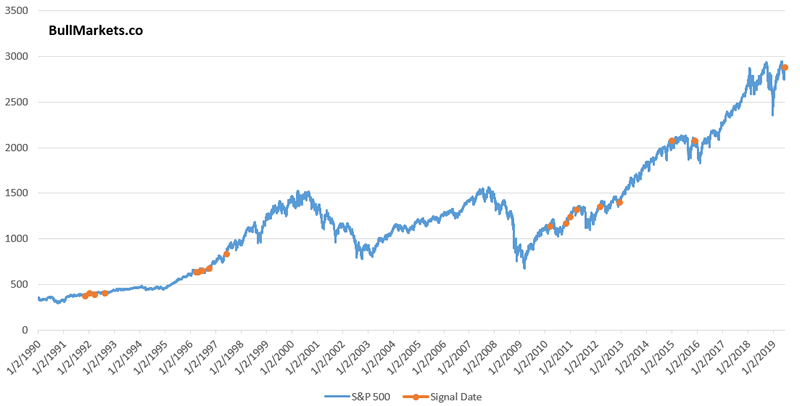
Slightly bullish over the next 1 week and mostly bullish 1 year later. Low intraday volatility is a hallmark of bull markets.
Low volume
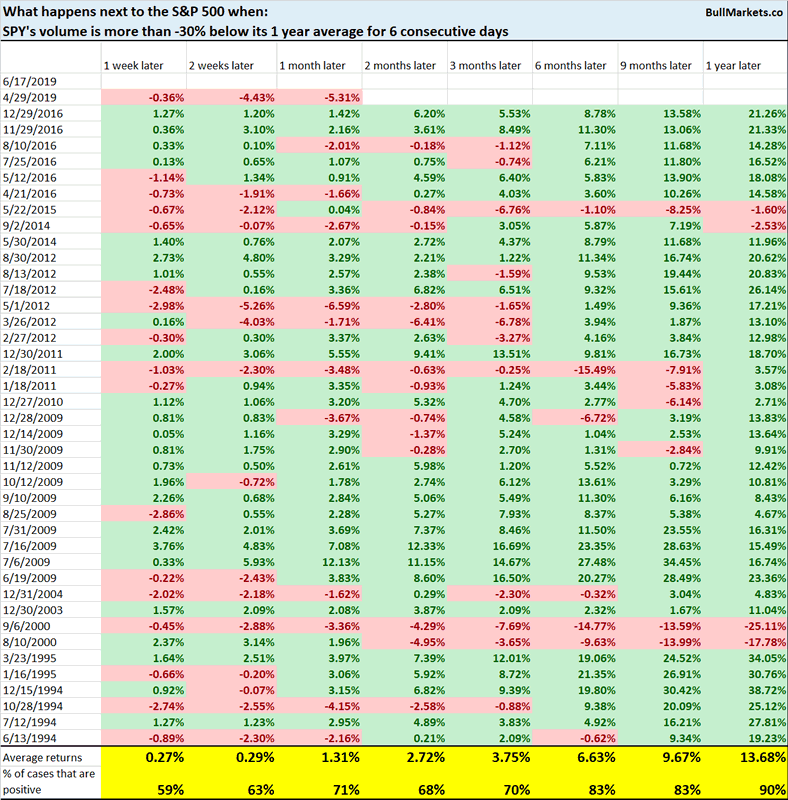
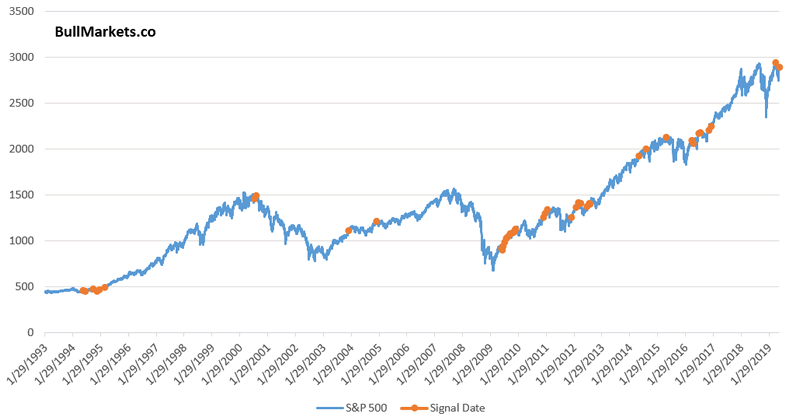
Low volume and small daily fluctuations tend to go hand-in-hand. With the stock market going nowhere over the past 6 days, SPY’s volume has been exceptionally low.
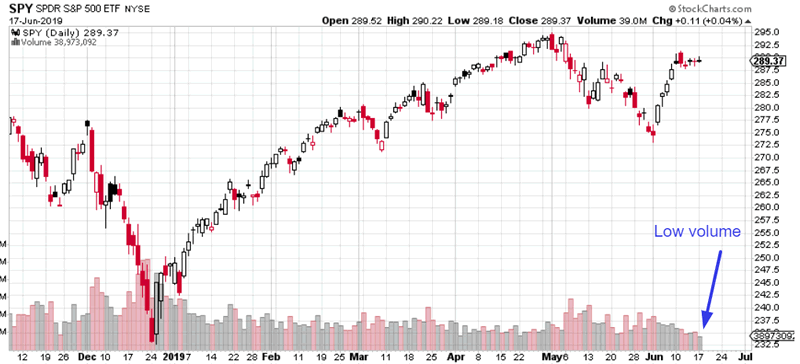
SPY’s volume has been more than -30% below its 1 year average for 6 consecutive days. Historically, this was mostly bullish for the S&P 6-12 months later. Low volume is a hallmark of bull markets.
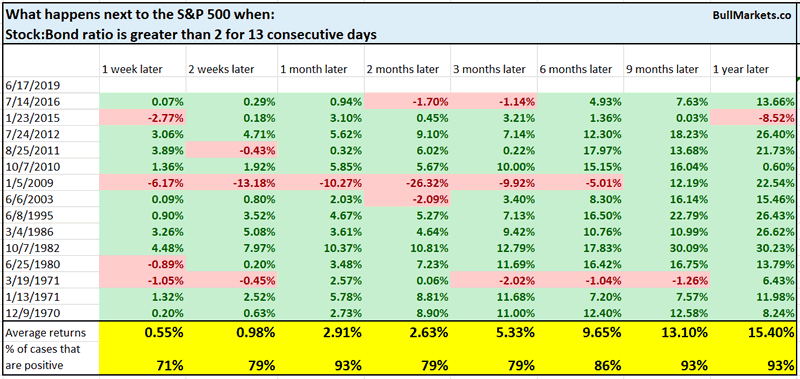
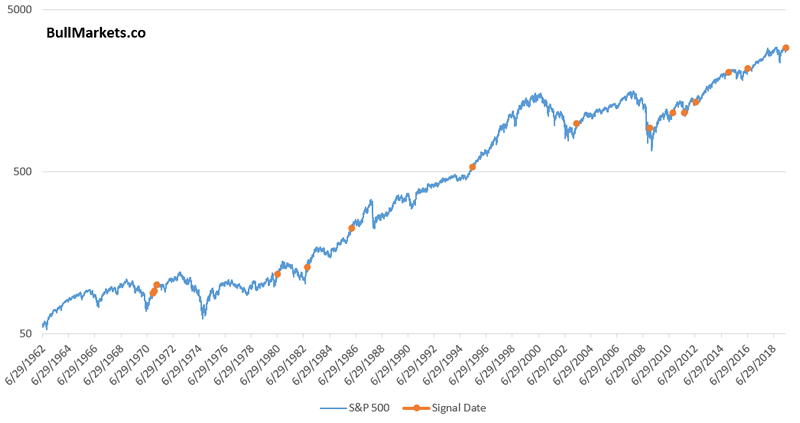
Stock:Bond ratio
Our Stock:Bond ratio is quite high right now. The ratio has been above 2 for 13 consecutive days.

Similar historical streaks were mostly bullish for the S&P on every time frame.
Correlation
To look at analogues objectively, we must calculate correlations.
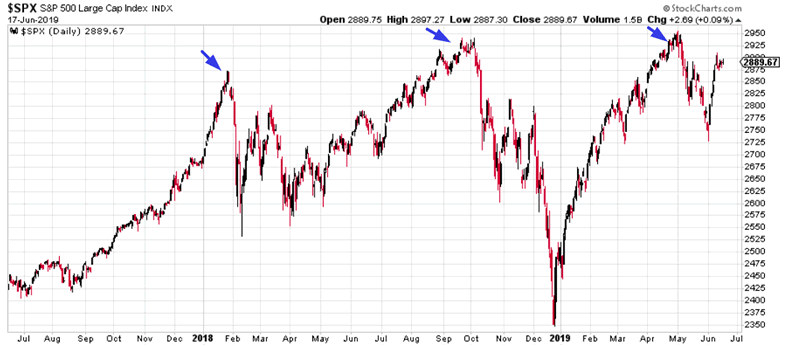
Over the weekend we looked at the S&P over the past 200 days vs other 200 day historical periods. But what if we looked at the S&P over the past 400 days vs other 400 day historical periods?
Afterall, a longer term chart “looks like” it could be making a triple top. Here’s the S&P
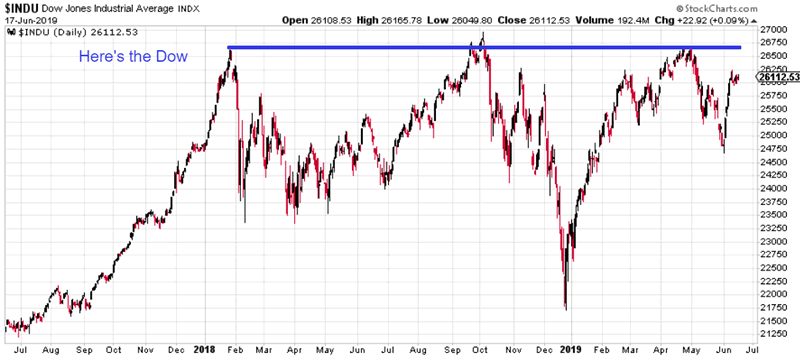
Here’s the Dow
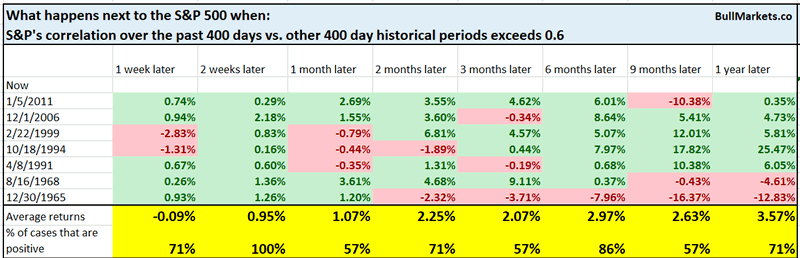
I looked at the S&P’s price over the past 400 days and compared it to other 400 day historical periods. Only 7 other historical cases had a correlation greater than 0.6
I did the same thing for the Dow, and there was only 1 historical case.
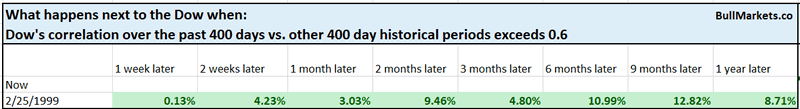
1999 was a late-cycle case, with only 1 year left in the bull market.
A key manufacturing gauge saw its biggest one-month decline in 18 years
Here’s the chart.
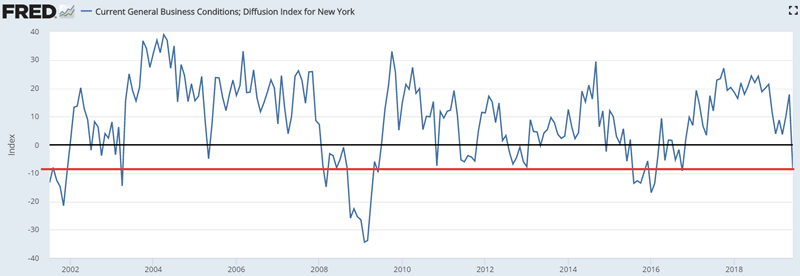
These headlines confirm the “economy is going to hell” narrative that’s so popular in the media and social media.
Here’s what happens next to the S&P when Empire State Manufacturing falls below -8
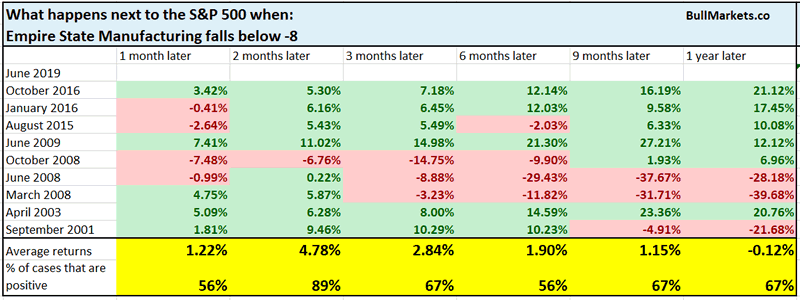
The stock market tends to bounce 2 months later, even during recessions (2001 and 2008).
Banks
While the stock market has made new highs over the past 2 years, banks have not. Here’s the KBW Bank Index vs. the S&P.
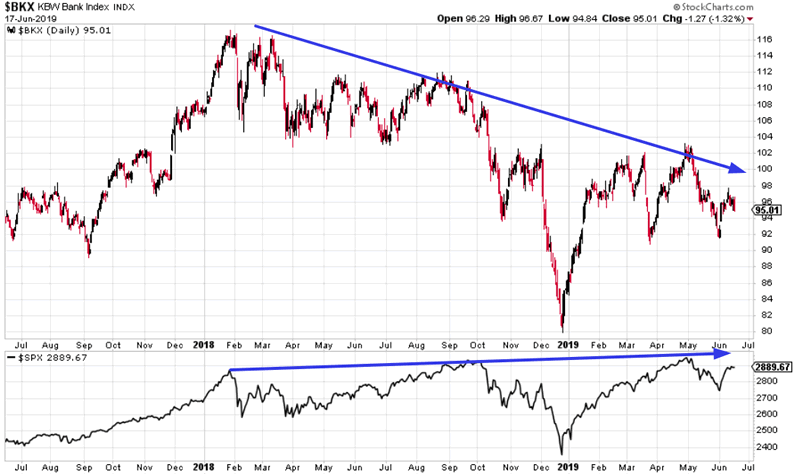
This is a very long divergence. Is it a bearish sign for the stock market?
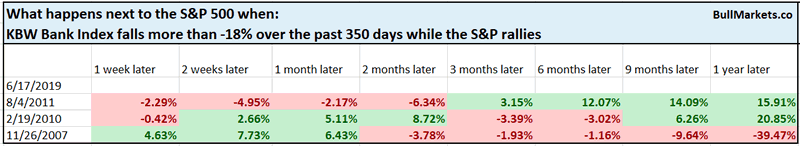
This is rare, but not consistently bullish or bearish. Financial stocks have underperformed throughout much of this 10 year bull market.
We don’t use our discretionary outlook for trading. We use our quantitative trading models because they are end-to-end systems that tell you how to trade ALL THE TIME, even when our discretionary outlook is mixed. Members can see our model’s latest trades here updated in real-time.
Conclusion
Here is our discretionary market outlook:
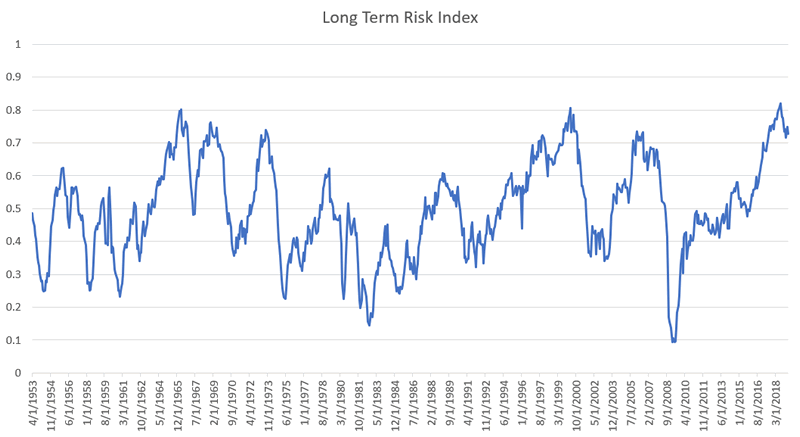
- The U.S. stock market’s long term risk:reward is not bullish. In a most optimistic scenario, the bull market probably has 1 year left.
- The medium term market studies (e.g. next 6-9 months) are mostly bullish.
- Market studies for the next 2-3 months lean bullish.
- Market studies over the next 2-4 weeks are mixed.
- We focus on the medium-long term.
Goldman Sachs’ Bull/Bear Indicator demonstrates that risk:reward does favor long term bears.
Click here for more market studies
By Troy Bombardia
I’m Troy Bombardia, the author behind BullMarkets.co. I used to run a hedge fund, but closed it due to a major health scare. I am now enjoying life and simply investing/trading my own account. I focus on long term performance and ignore short term performance.
Copyright 2019 © Troy Bombardia - All Rights Reserved
Disclaimer: The above is a matter of opinion provided for general information purposes only and is not intended as investment advice. Information and analysis above are derived from sources and utilising methods believed to be reliable, but we cannot accept responsibility for any losses you may incur as a result of this analysis. Individuals should consult with their personal financial advisors.
© 2005-2022 http://www.MarketOracle.co.uk - The Market Oracle is a FREE Daily Financial Markets Analysis & Forecasting online publication.