


Stocks Break Downward In Afternoon Trading
Stock-Markets / Stock Markets 2019 May 29, 2019 - 12:51 PM GMTBy: Chris_Vermeulen

 The afternoon price breakdown in the YM (Down Futures) continues to confirm our recent analysis. We authored a three-part research post near mid-May discussing how the global tensions would likely play out in the global stock markets. We also authored another, more recent, research post about how the US stock markets would likely find weakness as news is digested after the US Memorial Day holiday weekend. If we go far enough back in our research, we can find a very interesting research post from March 31, 2019, where our research team suggested July 2019 would be a key date for a potential market top formation.
Today, we are going to focus on the downside price rotation that is happening in the YM (Dow Futures) and how it points to an extended sideways Pennant/Flag price formation over the next few weeks before a breakdown move may cause havoc in the markets.
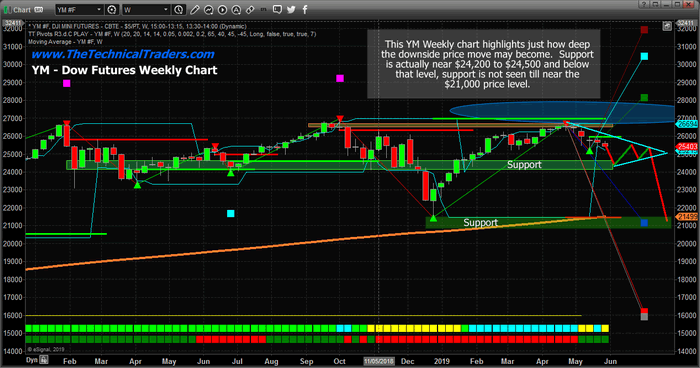
This Weekly YM chart highlights our expectations that the US stock market is entering a sideways price pattern formation that will likely result in a Pennant/Flag setup. After the deep downward price rotation in Jan/Feb 2018 and another one over the Oct to Dec 2018 span, this recent upside price move failed to breach our Adaptive Fibonacci bullish price trigger level near $26,990. This failure results in a “failed upside leg” currently – suggesting a new downside price leg will form in an attempt to re-establish price support before any new upside price leg will begin again.
Currently, the Bearish Fibonacci Price trigger level is near $21,415. We do not expect the YM price to fall to this level right away – yet it is a possible target if the markets fail to find any support or the global perspective changes regarding the US stock market. Our expectation is that support near $24,250 to $24,500 will hold up throughout this current rotation – over the next 4 to 10+ weeks.
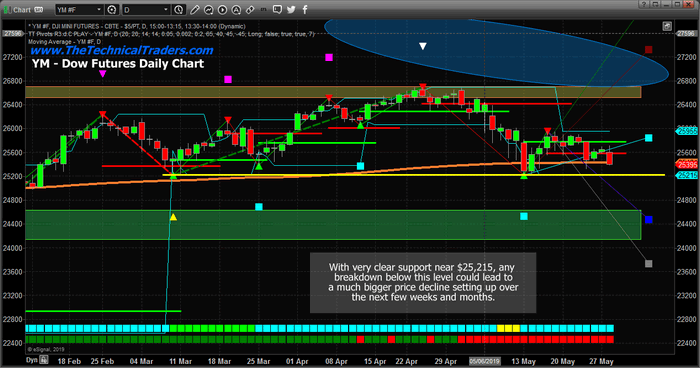
This Daily YM chart provides a better shorter-term look at price rotation and our Adaptive Fibonacci price modeling system. It is clear that the recent lows near May 13 prompted a “new price low” setup. This is key to understanding the fundamental elements of the Fibonacci Price Theory. This new price low tells us the current trend is Bearish and that until the price is able to breach the $26,800 level, we should consider the trend bias to be moderately bearish. The BLUE downside price target near $24,400 now becomes our support level and the multiple lows near the $25,215 level become our immediate price floor.
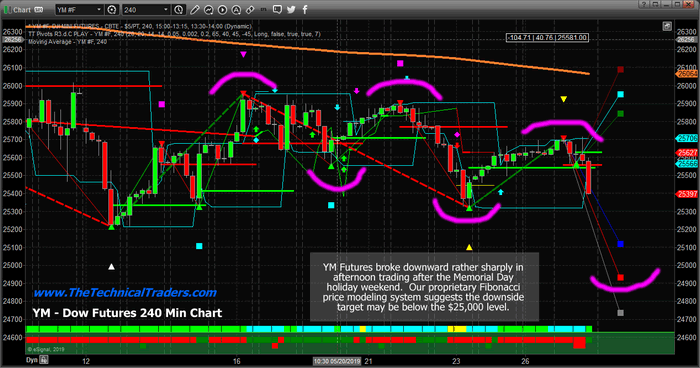
This 240-minute YM chart highlights the peak/valley price rotation levels that have supported this downside price move over the past few weeks. Pay very close attention to how these peaks/valleys have all aligned in a downward trend and how our Adaptive Fibonacci price modeling system is suggesting a move toward $24,900 is about to unfold.
Now is the time for traders to prepare for a weakening US stock market price rotation with a very strong potential for a retest of support levels. Our expectations are support will be found near $24,200 (-8.9% from recent highs) or near $21,450 (-19% from recent highs). The key to how this move plays out is if the Pennant/Flag formation we are suggesting will form or not. If it does, we’ll have lots of time to prepare for this downside move. If not, it could be a very fast decline to support levels.
Remember, we’ve been warning about this move for many months. We keep suggesting that 2019 and 2020 are going to be incredible years for members of our Wealth Trading Newsletter. We’ve recently authored multiple articles calling for a July/Aug top in the markets and our research continues to suggest that Gold and Silver are dramatically undervalued right now. It’s almost like the old saying “we told you so” – but we just want everyone to be prepared for what is likely to happen. Read our research posts from earlier this year and please try to understand that our proprietary predictive modeling solutions allow us to see into the future with some extra level of clarity that many people don’t have.
3 DAYS LEFT TO GET YOUR FREE SILVER ROUNDS WITH SUBSCRIPTION!
We continue to see money flow into the safe-haven assets like the Utility sector, bonds, and most importantly precious metals. I anticipated this and our XLU utilities ETF taken with members for 4.4% already, and our VIX ETF trade we closed for a 25% last week.
For May I am going to give away and ship out silver rounds to anyone who buys a 1-year, or 2-year subscription to my Wealth Trading Newsletter. You can upgrade to this longer-term subscription or if you are new, join one of these two plans listed below, and you will receive:
SUBSCRIBE TO MY TRADE ALERTS AND GET YOUR FREE SILVER ROUNDS!
Chris Vermeulen
www.TheTechnicalTraders.com
Chris Vermeulen has been involved in the markets since 1997 and is the founder of Technical Traders Ltd. He is an internationally recognized technical analyst, trader, and is the author of the book: 7 Steps to Win With Logic
Through years of research, trading and helping individual traders around the world. He learned that many traders have great trading ideas, but they lack one thing, they struggle to execute trades in a systematic way for consistent results. Chris helps educate traders with a three-hour video course that can change your trading results for the better.
His mission is to help his clients boost their trading performance while reducing market exposure and portfolio volatility.
He is a regular speaker on HoweStreet.com, and the FinancialSurvivorNetwork radio shows. Chris was also featured on the cover of AmalgaTrader Magazine, and contributes articles to several leading financial hubs like MarketOracle.co.uk
Disclaimer: Nothing in this report should be construed as a solicitation to buy or sell any securities mentioned. Technical Traders Ltd., its owners and the author of this report are not registered broker-dealers or financial advisors. Before investing in any securities, you should consult with your financial advisor and a registered broker-dealer. Never make an investment based solely on what you read in an online or printed report, including this report, especially if the investment involves a small, thinly-traded company that isn’t well known. Technical Traders Ltd. and the author of this report has been paid by Cardiff Energy Corp. In addition, the author owns shares of Cardiff Energy Corp. and would also benefit from volume and price appreciation of its stock. The information provided here within should not be construed as a financial analysis but rather as an advertisement. The author’s views and opinions regarding the companies featured in reports are his own views and are based on information that he has researched independently and has received, which the author assumes to be reliable. Technical Traders Ltd. and the author of this report do not guarantee the accuracy, completeness, or usefulness of any content of this report, nor its fitness for any particular purpose. Lastly, the author does not guarantee that any of the companies mentioned in the reports will perform as expected, and any comparisons made to other companies may not be valid or come into effect.
Chris Vermeulen Archive |
© 2005-2022 http://www.MarketOracle.co.uk - The Market Oracle is a FREE Daily Financial Markets Analysis & Forecasting online publication.