If History Is Any Indication, Stocks Should Rally Until the Fall of 2020
Stock-Markets / Stock Markets 2019 Apr 15, 2019 - 06:19 PM GMTBy: Robert_Foss
 Something unusual happened in the stock market recently.
A few weeks ago, a closely watched indicator, called the “yield curve,” inverted for the first time since the last recession.
This is a concrete sign the economy is slowing.
In fact, the yield curve has inverted before every recession over the past 50 years… but not immediately before, as I’ll explain in a moment.
Good news is, the yield curve inversion also means stocks should continue to rise for the next 12–18 months or so.
But let’s back up a little…
When investors talk about the yield curve, they’re referring to the difference between the yield on the 10-year Treasury note and the 3-month Treasury bill.
Consider the yields from March 27, for example. The 10-year Treasury note was yielding 2.42%. And the 3-month Treasury bill was yielding 2.47%. So, the difference was -0.05%.
Whenever this number is negative—as it was for about a week in March—it means the yield curve has inverted. (It’s since crept back into positive territory, but not by much.)
This Isn’t Normal
An inverted yield curve is a strong sign that investors are worried about the economy.
Here’s why…
As you likely know, US Treasuries are bonds issued by the US government—the safest lender on the planet. That means they’re as close to “risk free” as possible.
The US Treasury issues these bonds for different lengths of time, ranging from three months to 30 years. This period is called the bond’s “maturity.”
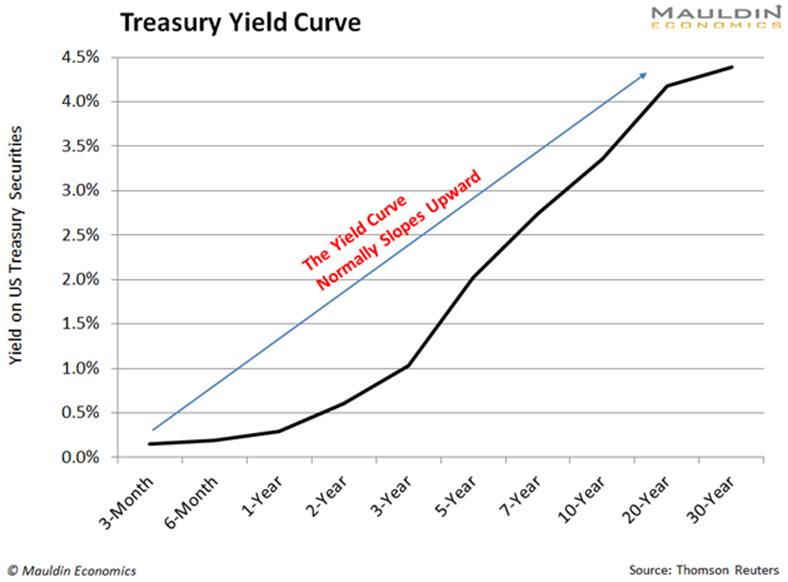
Normally, investors demand higher yields for longer-term bonds.
That makes sense. It’s much easier to predict economic changes or major world events three months out than 30 years out. So, people demand higher yields to compensate for the greater uncertainty.
When investors follow this pattern, the longer the maturity, the higher the yield. You can see this in the chart below, which shows Treasury yields forming their usual, upward sloping curve.

Source: Mauldin Economics
When the yield curve inverts—like it did last month—the opposite happens.
Again, this is a sign that investors expect the economy to slow soon. It also means they think long-term Treasuries, like 10- and 30-year bonds, are safer than short-term Treasuries.
Expect a Recession, but Not Tomorrow
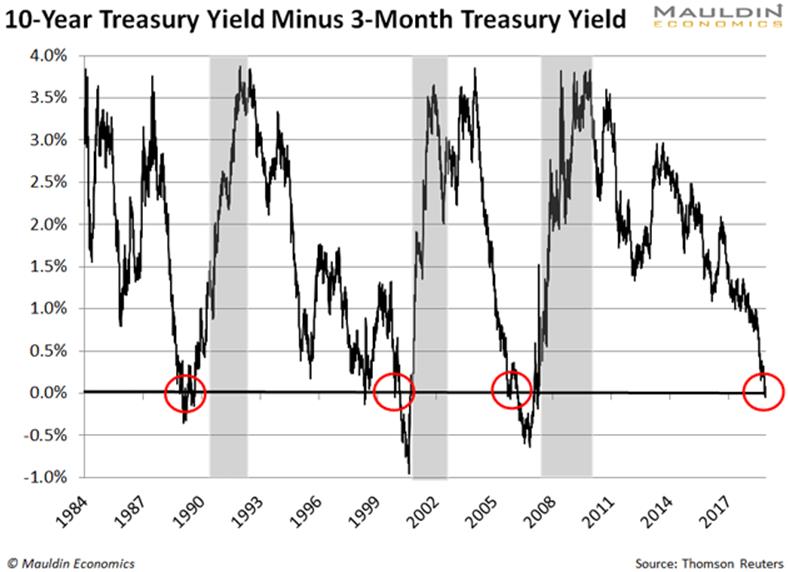
When the yield curve inverts, analysts pay close attention. That’s because it’s happened before every recession over the past 50 years, as I mentioned earlier.
You can see the inversion shortly before the last three recessions in the next chart. (Yield curve inversions are circled in red, and recessions are highlighted in grey.)

Source: Mauldin Economics
Now, no one wants to hear that a recession is coming. Upside is, the yield curve inverted 18 months before the last three recessions, on average.
In other words, a recession is coming, but not tomorrow.
The same logic applies to the stock market…
Stocks Could Continue to Climb Until September 2020
The recent yield curve inversion is a positive sign for stocks, at least for now. That’s because the S&P 500 rose significantly after the last three inversions.
You can see this in the table below.

Source: Mauldin Economics
In the 18 months after the last three inversions, the S&P 500 returned an average of 32%. That’s a major gain. In fact, it equals the return on the S&P 500 since August 2016.
So, you can expect stocks to continue to climb until about September 2020.
Don’t Go on a High-Risk Spending Spree
Sure, history says the stock market should perform well for the next 12–18 months.
However, at this point, buying risky stocks is like picking up pennies in front of a steamroller. You might make solid gains at first… then get squashed, losing most or all of your money.
I think investors tend to take on too much risk, even in normal market conditions. But, with the stock market near all-time highs and the recent yield curve inversion, this is truer than ever.
For income investors in particular, controlling risk in this sort of environment is paramount.
Now is the time to buy safe and reliable dividend-paying stocks. That means high quality utilities, insurance companies, consumer staple companies, and the like. Think companies that provide goods or services people use no matter what’s happening in the economy or the markets.
After all, when this recession hits, people will still heat up their stoves and pay their car insurance.
My Favorite Bulletproof Dividend Stocks for 2019
I’ve recently put together a special report where I reveal some of my favorite bulletproof dividend stocks for 2019. It’s free for a limited time. Claim your copy now.
By Robert Foss
© 2019 Copyright Robert Foss. - All Rights Reserved Disclaimer: The above is a matter of opinion provided for general information purposes only and is not intended as investment advice. Information and analysis above are derived from sources and utilising methods believed to be reliable, but we cannot accept responsibility for any losses you may incur as a result of this analysis. Individuals should consult with their personal financial advisors.
© 2005-2022 http://www.MarketOracle.co.uk - The Market Oracle is a FREE Daily Financial Markets Analysis & Forecasting online publication.


