The 'Silver Lines' of Opportunity
Commodities / Gold & Silver 2019 Apr 13, 2019 - 06:48 PM GMTBy: EWI
 How to turn a simple chart into a near-term road map
On February 20, Variety Magazine's "Film News Roundup" announced a new thriller coming to theaters near you: "The Silver Bear."
Funny enough, that same day, another kind of thriller was playing out in the theater of finance; its name, the Silver Bull!
The chart below captures the action: Since the start of 2019, silver prices had been on a tear, soaring to $14, $14.50, $15, $15.50 and then $16 per ounce in late February in a white-hot winning streak that has outperformed even gold.
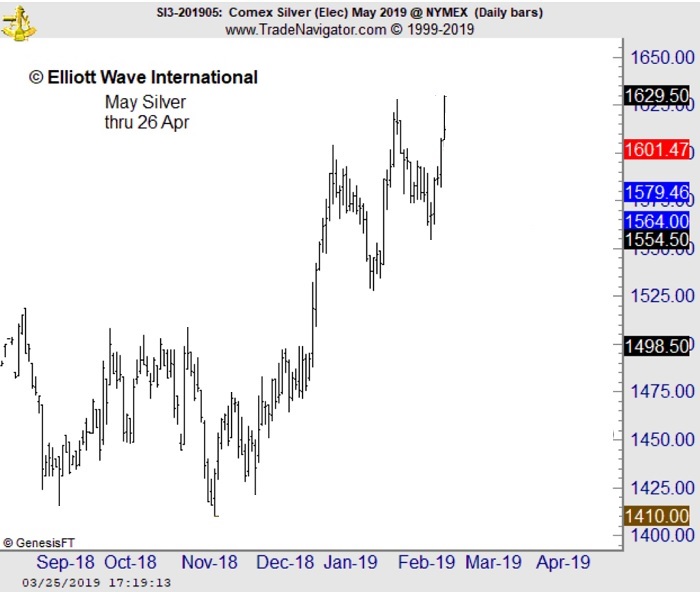
Thanks to a wide array of supportive fundamentals including a softening U.S. dollar, a dovish Federal Reserve, increased economic uncertainty and a subsequent rise in demand for traditional "safe havens" such as gold and silver -- mainstream news outlets captured the Silver Bull sentiment on high:
"Is Silver About to Explode?" (Feb. 21 Seeking Alpha)
"Silver Market Steadily Building Up Momentum" (Feb. 19 Commodity Trade Mantra)
"Silver Experiences A Bullish Development that Points to Higher Prices" (Feb. 20 ETF Daily News)
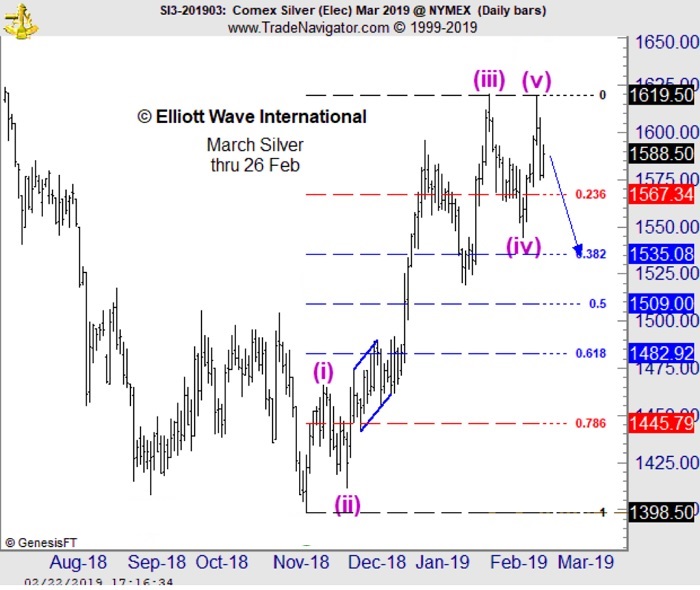
Yet, off the mainstream screen, we had a very different take on silver's rally. On February 21, our Metals Pro Service identified a classic Elliot wave "impulse" underway from the November 2018 low to the February 20 high above $16 per ounce. And, it was close to being finished.
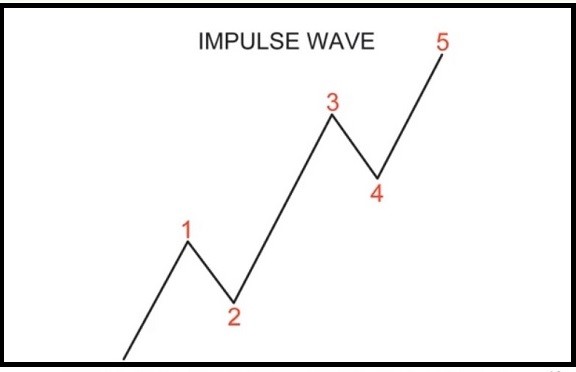
For newbies, here is an idealized diagram of an impulse wave, defined as a five-wave move labeled 1 through 5 that adheres to three cardinal rules:
- Wave 2 can never retrace more than 100% of wave 1.
- Wave 3 is never the shortest among waves 1, 3 and 5.
- And wave 4 can't end in the price territory of wave 1.
The February 21 Metals Pro Service labeled the impulsive rise on silver's price chart and warned of a pending reversal:
"Silver may have topped...at 16.19 and be correcting the entire rise from 13.98 now."
So, what should you expect after a five-wave impulse is complete?
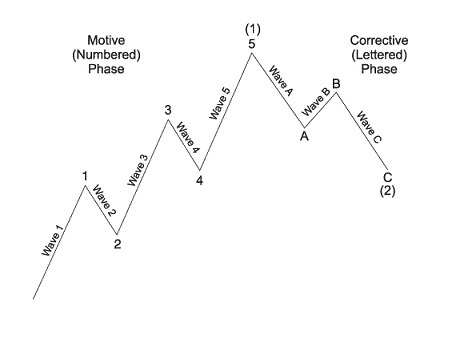
By their very nature, an impulse move is followed by a correction, often unfolding in three waves (A-B-C) and pushing back into the span of travel of the prior fourth wave. See diagram below:
Wrote our Metals Pro Service on February 21:
"The move should develop in three waves and reach the 15.35 area over the coming days."
The white metal followed in-step, embarking on a powerful, two-week long selloff to below $15 per ounce.
Then, on March 7, our Metals Pro Service turned near-term bullish. Why?
Because now the three-wave, A-B-C correction was complete, too. On March 7, Metals Pro Service silver outlook set the stage for gains:
"On the upside, an impulsive rally above 15.17 will hint that a bottom is in place and that the larger-degree uptrend has re-ignited."
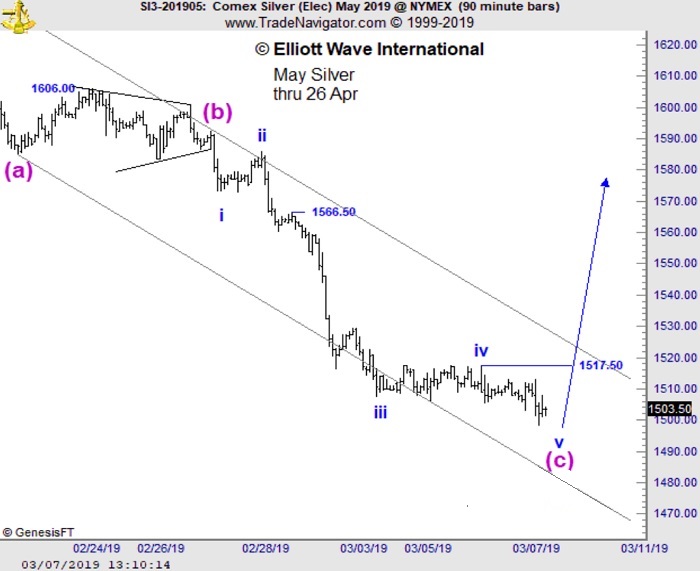
From there, silver regained its shine right into our cited upside target area on March 21 -- before turning back down.
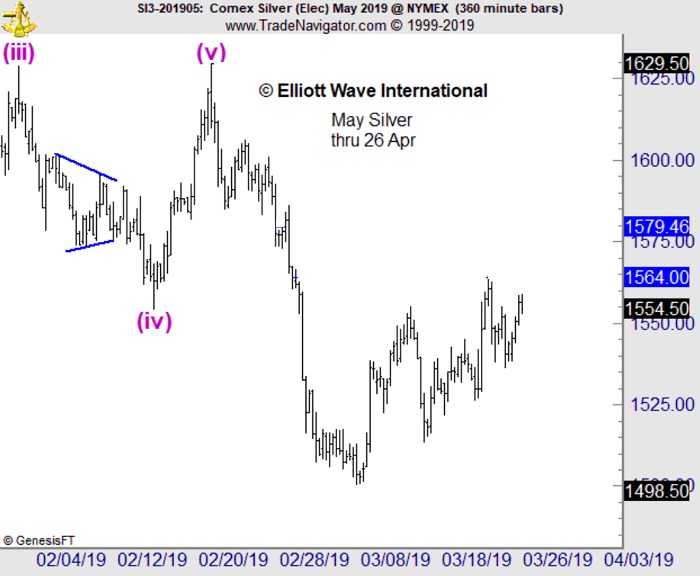
So, where are silver prices likely headed from here?
Our Metals Pro Service analysis reveals that right now. Watch our Metals expert, Tom Denham, discuss his exciting analysis and exactly what he sees next for this precious metal in his March 28 Metals Pro Service subscriber update. Sign up now for instant access.
This article was syndicated by Elliott Wave International and was originally published under the headline The 'Silver Lines' of Opportunity. EWI is the world's largest market forecasting firm. Its staff of full-time analysts led by Chartered Market Technician Robert Prechter provides 24-hour-a-day market analysis to institutional and private investors around the world.
© 2005-2022 http://www.MarketOracle.co.uk - The Market Oracle is a FREE Daily Financial Markets Analysis & Forecasting online publication.


