


The Stock Market is Eerily Quiet
Stock-Markets / Stock Markets 2019 Apr 04, 2019 - 06:14 PM GMTBy: Troy_Bombardia

The stock market went nowhere today and volume was extremely low. Traditional technical analysis sees low volume rallies as an ominous sign (“volume must confirm price”, “air is getting thin at the top”, etc)
Go here to understand our fundamentals-driven long term outlook.
Let’s determine the stock market’s most probable medium term direction by objectively quantifying technical analysis. For reference, here’s the random probability of the U.S. stock market going up on any given day.

*Probability ≠ certainty. Past performance ≠ future performance. But if you don’t use the past as a guide, you are blindly “guessing” the future.
VIX
Speculators are heavily net-short VIX, which contrarian traders have taken to imply that VIX will surge. They’re right. VIX will “eventually” surge because it is lower-bound. But the million dollar question is “when”.
The “divergence” between the S&P and VIX has gotten some attention recently among financial media and social media circles.
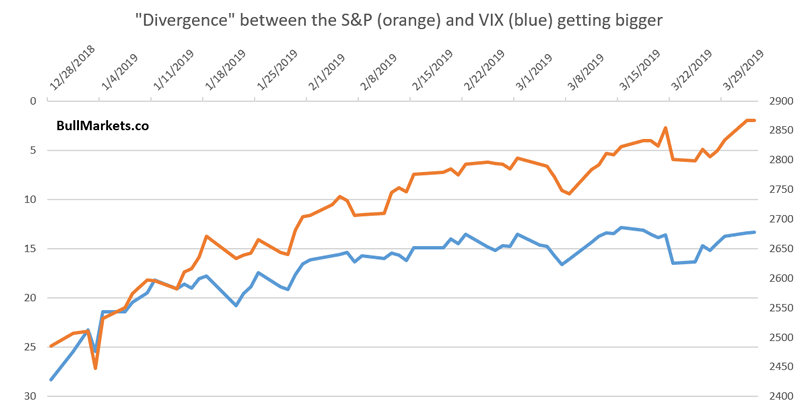
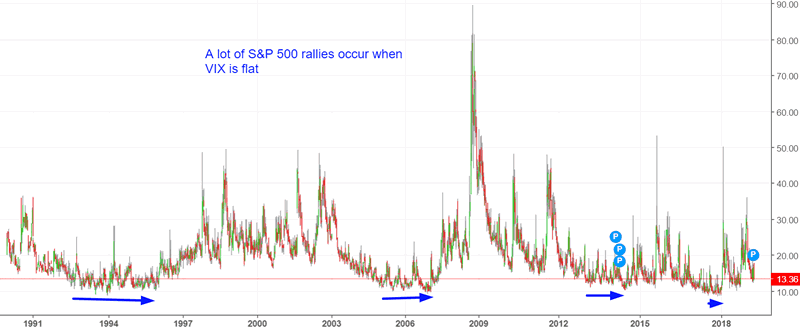
This divergence doesn’t make a lot of sense because VIX is lower-bound in the low double digits. I.e. A LOT of rallies occur when VIX is flat. Not exactly a divergence.
On a shorter term note, VIX has made “higher lows” over the past 12 days while the S&P 500 has made “higher highs”.
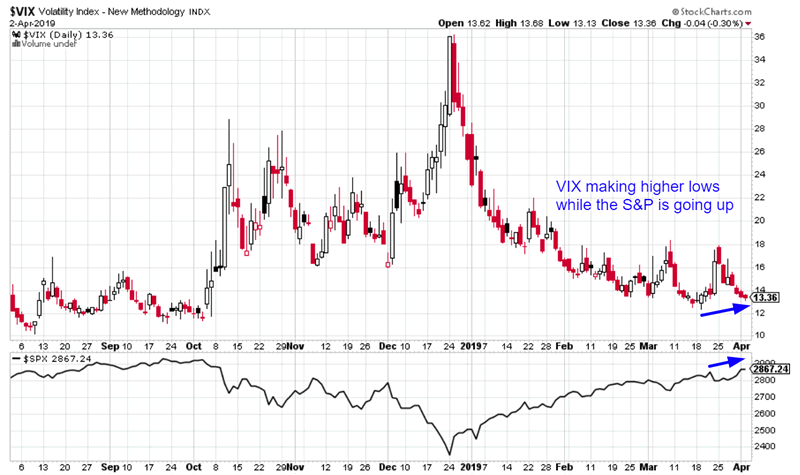
Is this divergence a bearish sign for the stock market?
Here’s what happens next to the S&P when the S&P rallies more than 1.5% over the past 12 days while VIX also rises more than 3%.
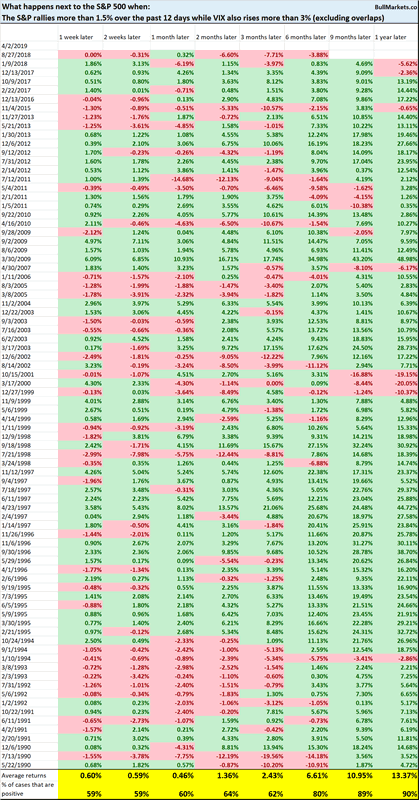
The stock market’s forward returns are random on shorter term time frames, and more bullish than random 6-12 months later.
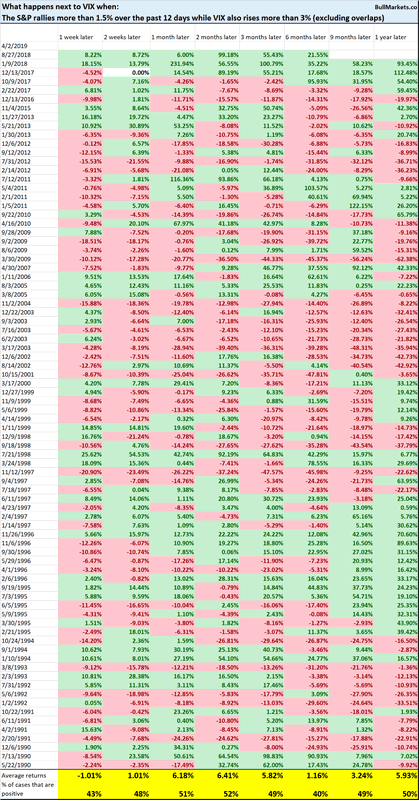
Here’s what happens next to VIX
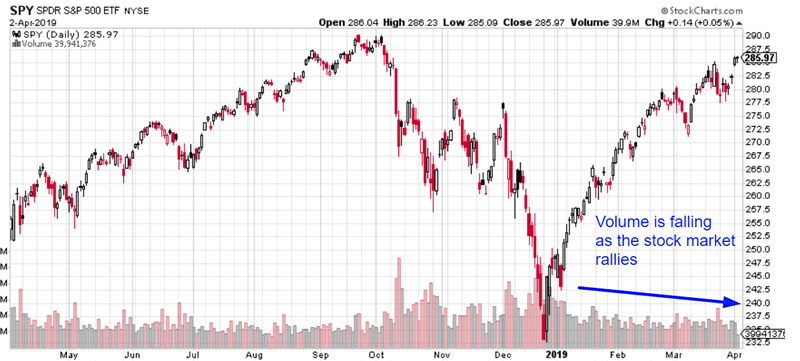
Volume
Today was a very low volume day in the stock market. Here’s SPY’s volume (SPY = S&P 500 ETF)

Is this a sign of “eerie quiet” in the markets? (I always found it a little funny how financial commentators would use Halloween-like terms to describe the market: “eerie” and “spooky”).
Here’s what happens next to the S&P when SPY volume is more than -50% below its 1 year average, while the S&P’s 14 day RSI is above 65 (i.e. low volume in an overbought market)
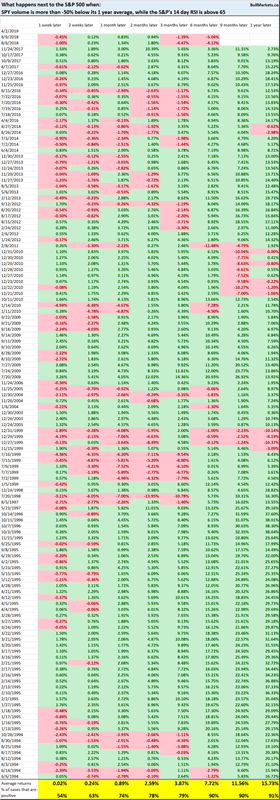
The stock market’s short term returns are mostly random. 6-12 months forward returns are more bullish than random. Why?
Because bear market rallies typically see much higher volume.
Earnings
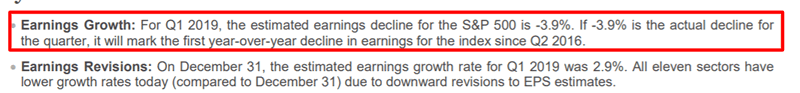
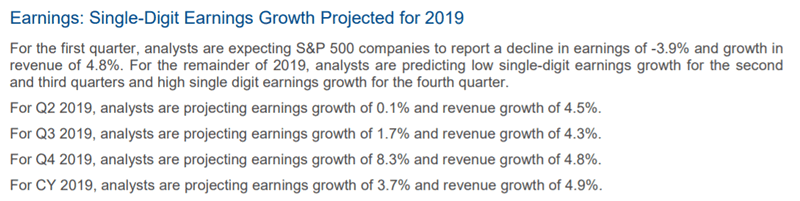
One of the real things to watch out for is earnings growth. Earnings growth will probably turn negative this quarter.
Here’s what happens next to the S&P when earnings growth falls below -3%, while Unemployment is under 6% (i.e. late-cycle cases)
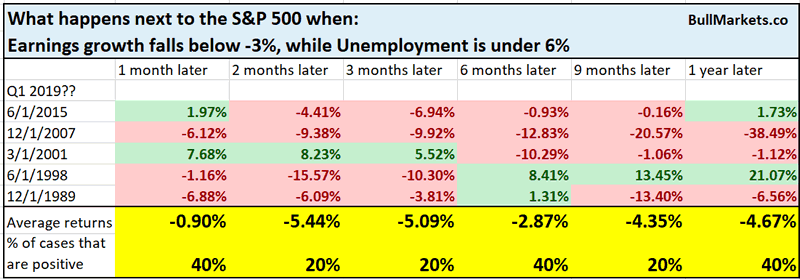
You can see that forward returns are more bearish than random. The most optimistic scenario is like 1998, in which the stock market fell -20% and then rallied another 1.5 years before the bull market ended.
So this is something to watch out for, but no need to immediately panic. Factset also estimates that earnings growth will turn positive after Q1 2019. (Earnings growth is turning negative partially due to a tough comparison post-Trump tax cuts).
Stock Bond Ratio
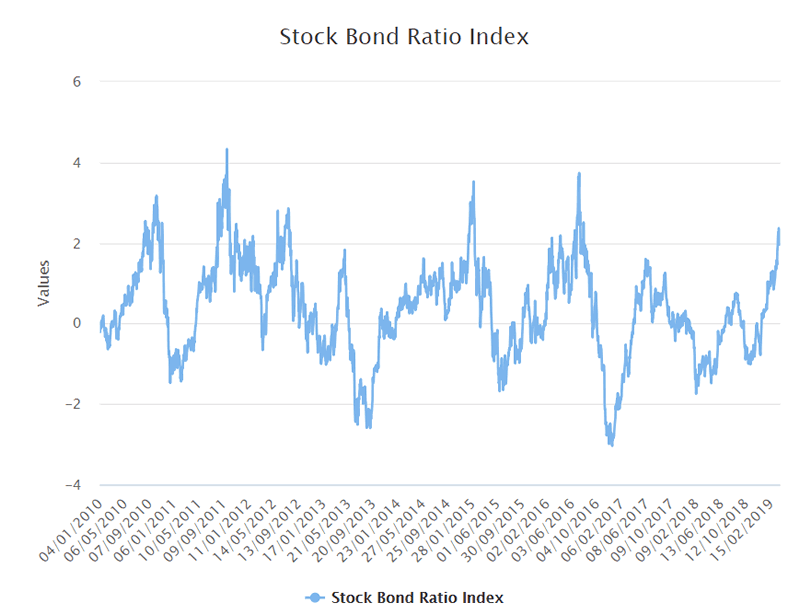
We created a Stock Bond Ratio in the Bull Markets Membership Program, which demonstrates the relationship between stocks and bonds as competing asset classes.
Our Stock Bond Ratio is extremely high right now.
Here’s what happens next to the S&P when the Stock:Bond Ratio exceeds 2.3
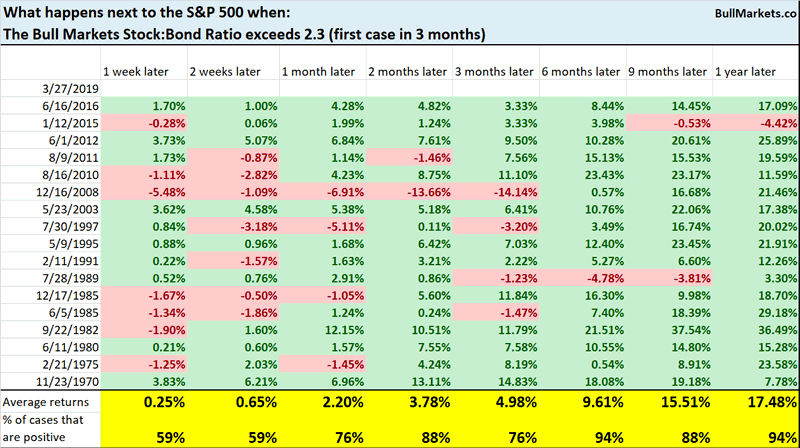
Once again, 6-12 month forward returns are more bullish than random.
Smart Money Flow
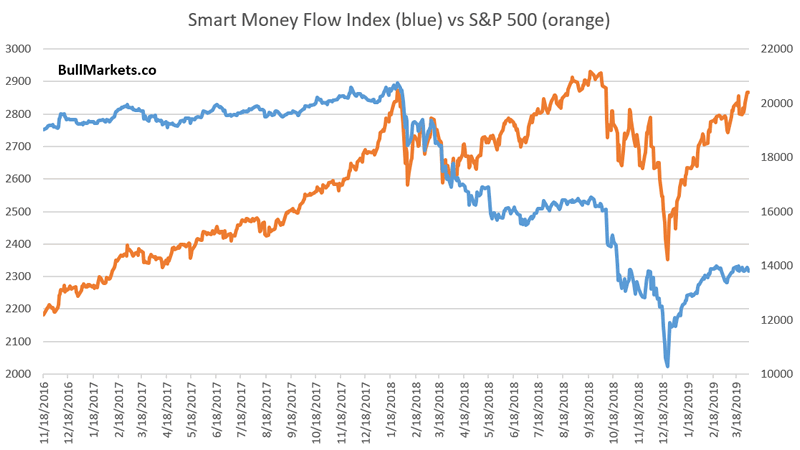
The Smart Money Flow Index is an indicator that receives attention from time to time in the media, most likely because it has a good name (“smart money”).
As you can see in the following diagram, the Smart Money Flow Index has collapsed and continues to lag the S&P 500.
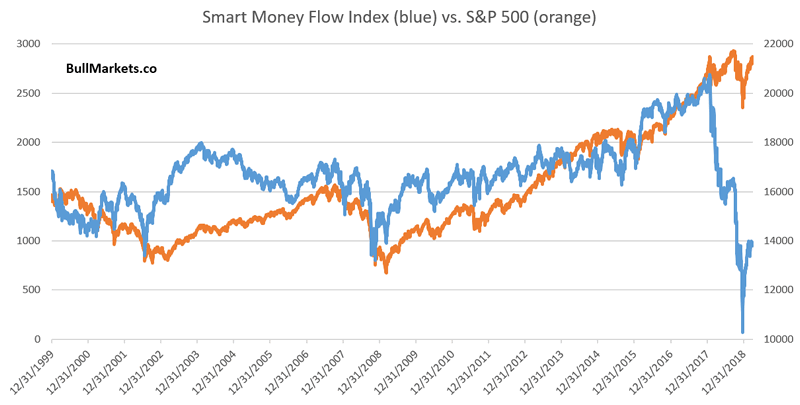
To make this chart seem more ominous, we can look at the recent “divergence” on a 20 year chart
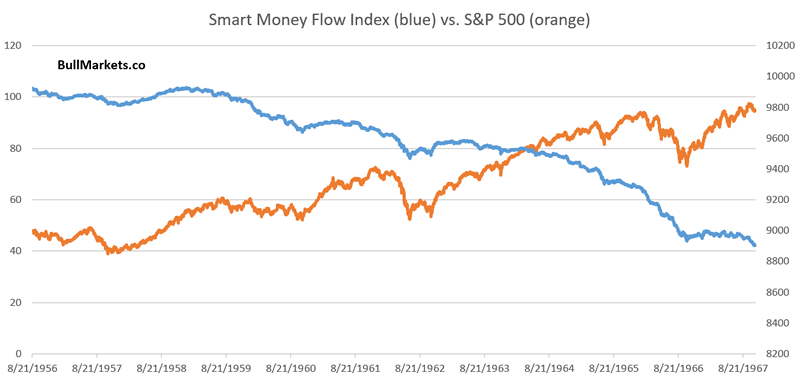
As we’ve explained in the past, there isn’t a whole lot that’s “smart” about the Smart Money Flow Index.
You can see that such a “divergence” occurred throughout the entire 1960s. Anyone who sold stocks because “smart money is selling!!!” would have missed out on a decade of gains.
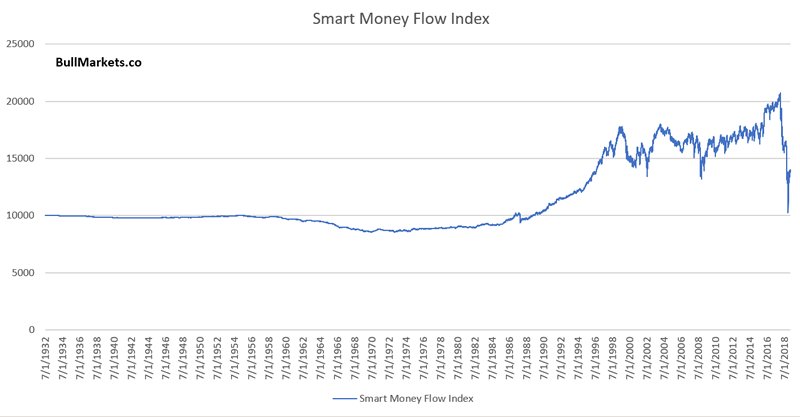
Here’s a long term chart of the Smart Money Flow Index. I guess the “smart money” wasn’t buying stocks from 1932 – 1986
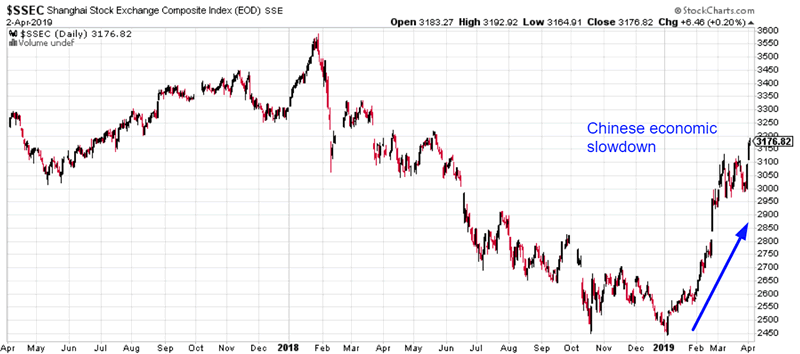
China
The financial markets are interesting. If you wanted to be popular and get interviewed on CNBC in the 1990s, you had to be a cheerleader for hot internet stocks. (“Money Honey” Maria Bartiromo was known to favor TV guests that hyped internet stocks). If you want to be popular today, you need to talk about why the U.S. will crash, China will crash, recession is imminent, yield curve inversion, etc. It’s a textbook case of recency bias. Trigger peoples’ most recent memories (1990s greed or post-2008 fear), and you will be famous.
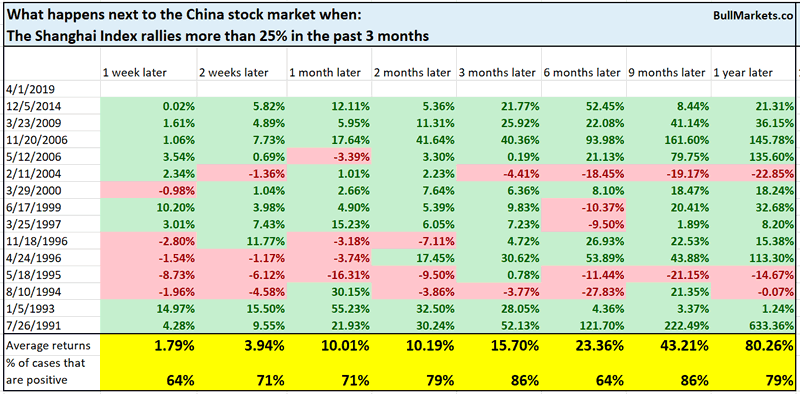
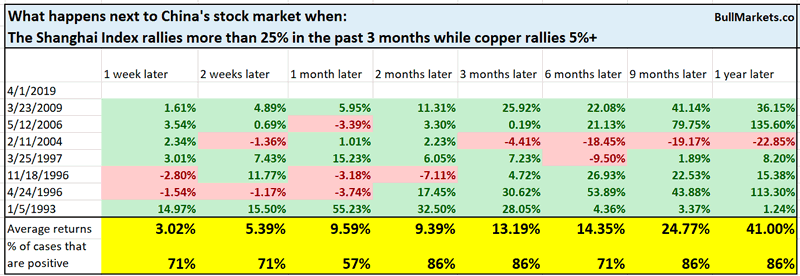
Amid the nonstop flow of “China is slowing down” headlines, China’s stock market is up more than 27% over the past 3 months.
Here’s what happens next to China’s stock market when it rallies 25%+ within 3 months.
This is not bearish for the S&P either:
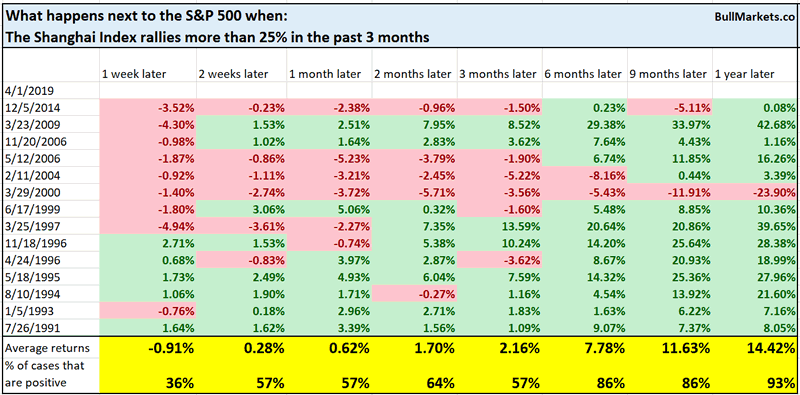
*Be careful when using other markets to predict the U.S. stock market. But at the very least, China’s rally isn’t bearish for U.S. stocks.
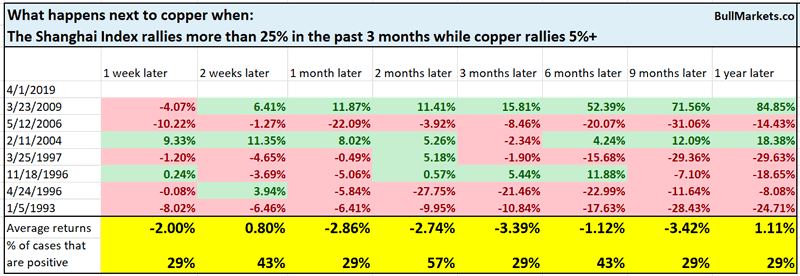
Copper is confirming China’s rally.
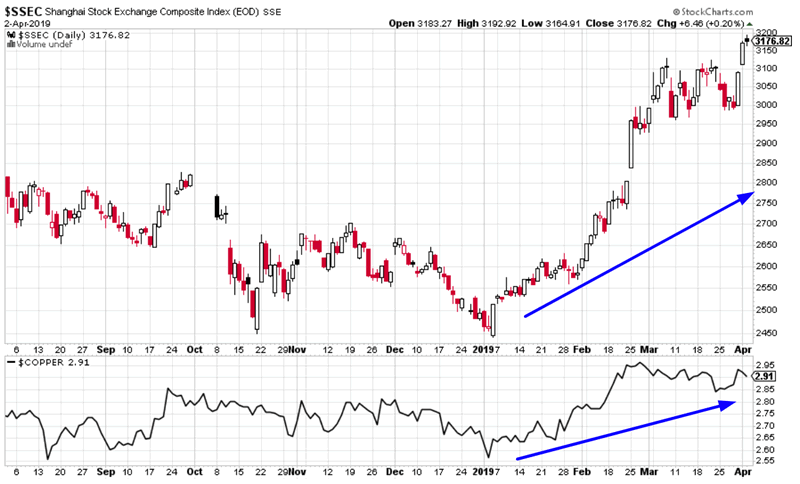
Interestingly enough, such “confirmations” are mostly bullish for China yet bearish for copper.
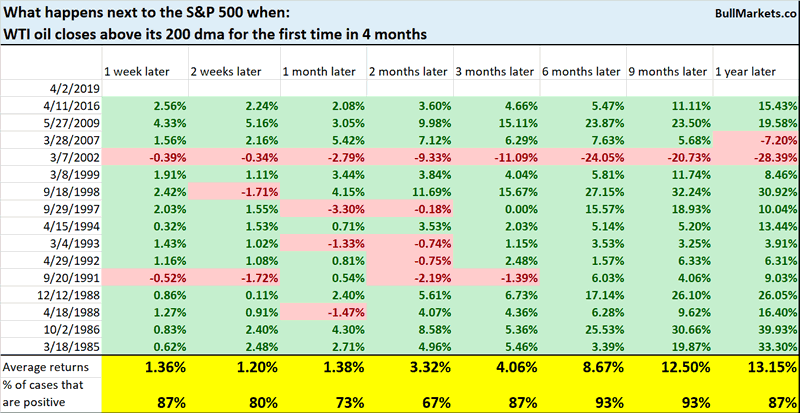
Oil
Oil has rallied above its 200 dma.
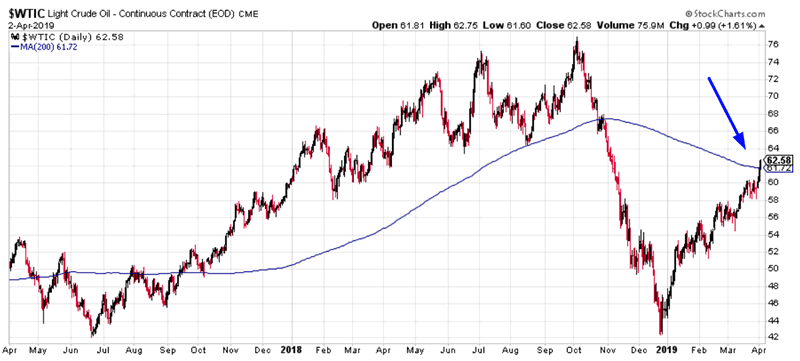
Is this breakout bullish for oil?
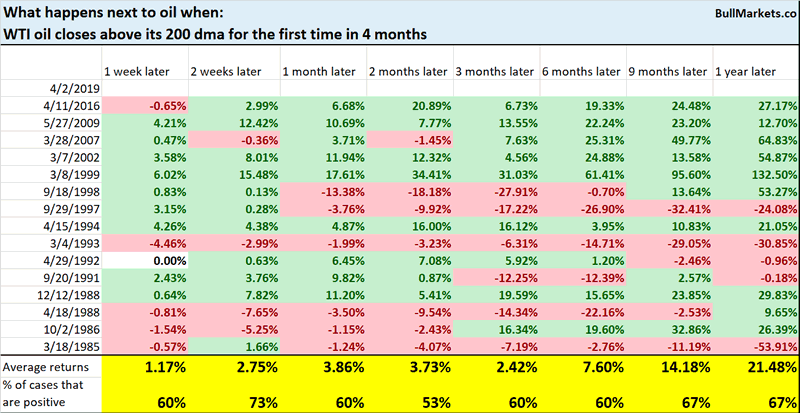
Not really. Close to random for oil.
At the same time, this is not bearish for the S&P 500.
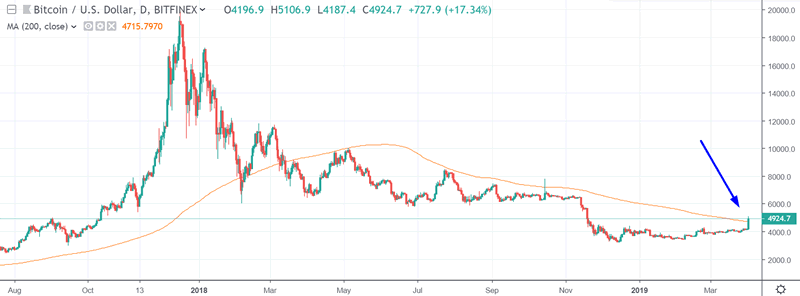
Bitcoin
And lastly, we come to Bitcoin, the land of fairy tales and broken dreams. Bitcoin has broken out above its 200 dma for the first time since early-2018.
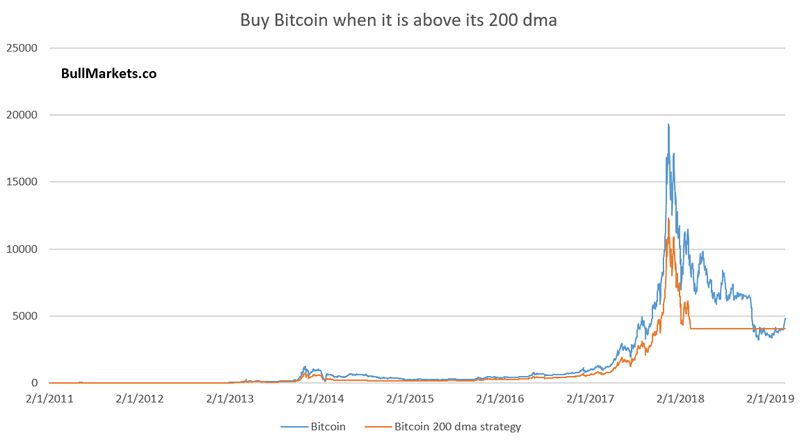
Here’s what happens when you employ the strategy “buy and hold Bitcoin only when it is above its 200 dma”.
In Bitcoin’s short history, there is only 1 other historical case in which Bitcoin broke out above its 200 dma for the first time in 1 year.
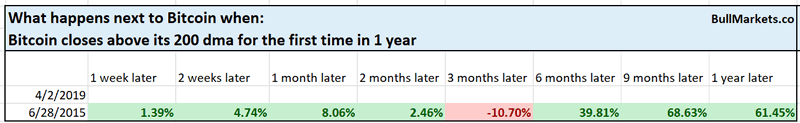
Perhaps Bitcoin will soar over the next year. Who knows. I don’t trade this. Just remember that fairy tales mostly don’t exist in the financial markets.
Read The stock market is very close to making an all-time high
Conclusion
Here is our discretionary market outlook:
- The U.S. stock market’s long term risk:reward is no longer bullish. In a most optimistic scenario, the bull market probably has 1 year left. Long term risk:reward is more important than trying to predict exact tops and bottoms.
- The medium term direction (e.g. next 6-9 months) is mostly mixed, although there is a bullish lean.
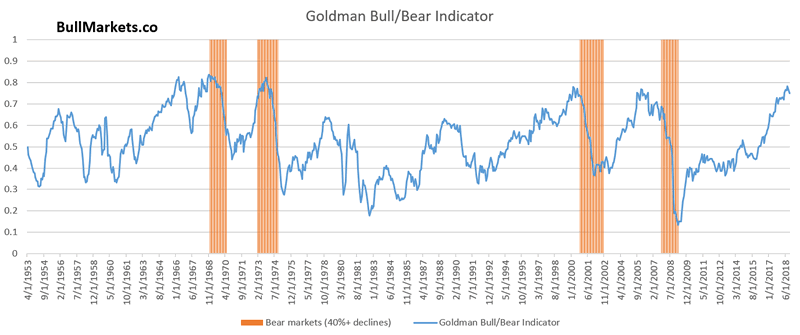
Goldman Sachs’ Bull/Bear Indicator demonstrates that while the bull market’s top isn’t necessarily in, risk:reward does favor long term bears.
Our discretionary market outlook is not a reflection of how we’re trading the markets right now. We trade based on our clear, quantitative trading models, such as the Medium-Long Term Model.
Members can see exactly how we’re trading the U.S. stock market right now based on our trading models.
Click here for more market studies
By Troy Bombardia
I’m Troy Bombardia, the author behind BullMarkets.co. I used to run a hedge fund, but closed it due to a major health scare. I am now enjoying life and simply investing/trading my own account. I focus on long term performance and ignore short term performance.
Copyright 2019 © Troy Bombardia - All Rights Reserved
Disclaimer: The above is a matter of opinion provided for general information purposes only and is not intended as investment advice. Information and analysis above are derived from sources and utilising methods believed to be reliable, but we cannot accept responsibility for any losses you may incur as a result of this analysis. Individuals should consult with their personal financial advisors.
© 2005-2022 http://www.MarketOracle.co.uk - The Market Oracle is a FREE Daily Financial Markets Analysis & Forecasting online publication.