


Is the Stock Market Still in a Bear Market?
Stock-Markets / Stock Markets 2019 Mar 13, 2019 - 05:23 PM GMTBy: Troy_Bombardia

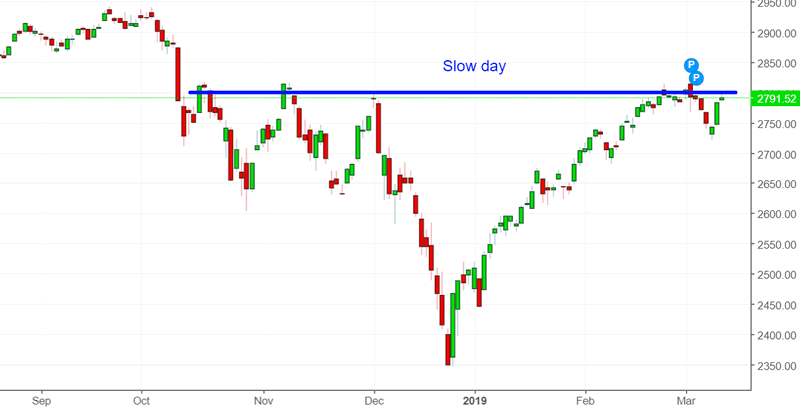
 The stock market has gone nowhere over the past 2 weeks. This is normal because most of the time, the stock indices simply aren’t as volatile as other markets like commodities. The big news today is that “bond king” Jeff Gundlach says that the stock market is still in a bear market, and that this is just a bear market rally.
Go here to understand our fundamentals-driven long term outlook.
Let’s determine the stock market’s most probable medium term direction by objectively quantifying technical analysis. For reference, here’s the random probability of the U.S. stock market going up on any given day.

*Probability ≠ certainty. Past performance ≠ future performance. But if you don’t use the past as a guide, you are blindly “guessing” the future.
The bond market “knows” something that stocks don’t
Here’s an often-used marketing trick from financial experts and trading gurus
- Overlap the S&P 500 onto another indicator. Make sure that the S&P and this indicator had a decent correlation over recent past.
- Demonstrate how the S&P is “decoupling” with the indicator right now.
- Adjust the scales on the S&P and indicator to increase the effect
- Crash crash crash crash.
*You see this trick on the WSJ and Zerohedge all the time.
Looks like the financial experts are back at it again.
This chart was quite popular in financial circles today.
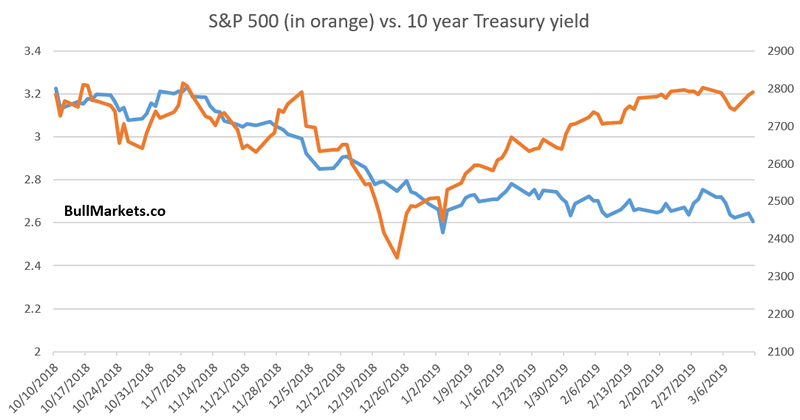
As you can see, the S&P and 10 year Treasury yield had a decent correlation from October 2018 – December 2018. Now “the S&P has ‘decoupled’ from the S&P”, which supposedly implies that stocks will crash crash crash.
This is an optical illusion designed by financial marketers experts to exploit your recent bias.
Reality: correlations break down all the time, and there is nothing bullish or bearish about this.
Here’s every single 50 day rally in which the S&P rallied 13%+ while the 10 Year Treasury Note ($TNX) fell more than -5%
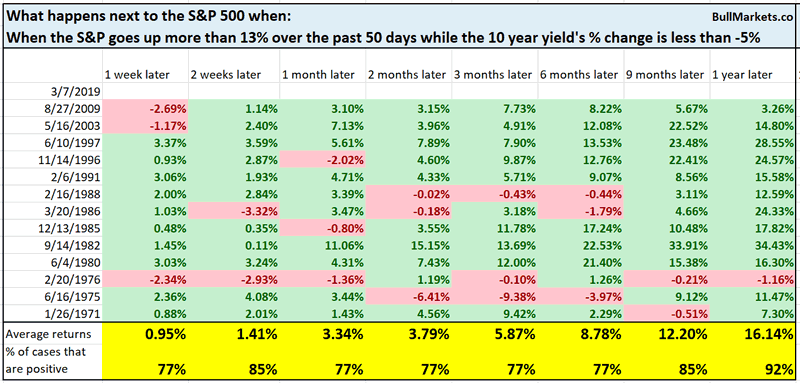
As you can see, this is more bullish than bearish for stocks. It’s perfectly normal for interest rates to fall when stocks are rallying.
No, the bond market doesn’t “knowing something that the stock market doesn’t”.
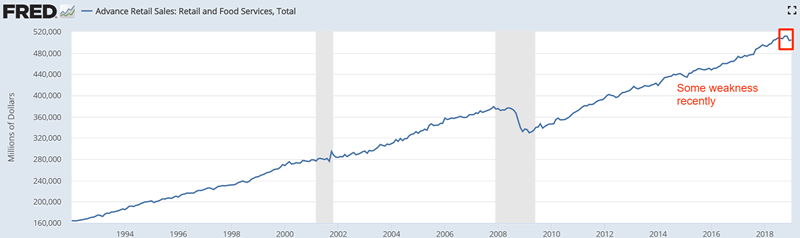
Retail Sales
Jeff Gundlach presented an interesting chart in his webcast today. Here is the 6 month change in Retail Sales.
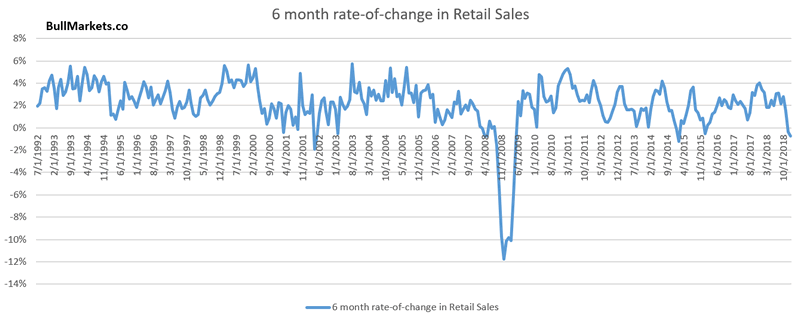
As you can see, Retail Sales have fallen a little over the past 6 months.
Here’s what happens next to the S&P when Retail Sales’ 6 month rate-of-change falls below -0.5%
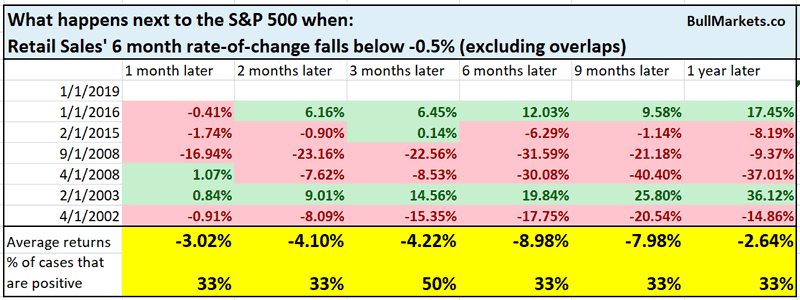
As you can see, this is indeed somewhat of a worry for the stock market. I am not extremely worried about this because:
- Retail Sales is not as useful an economic indicator as other leading indicators (e.g. in housing, credit, labor markets)
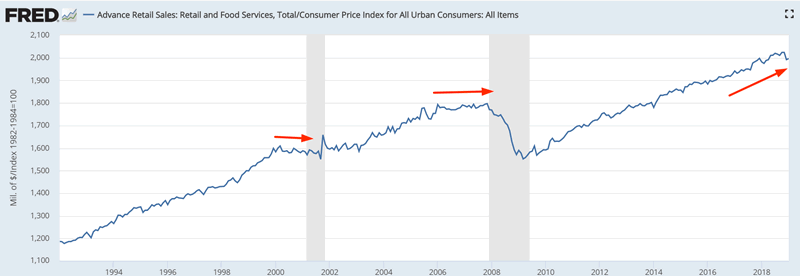
- The trend in Retail Sales is more important than its 6 month rate-of-change
XLU and real estate like the dot-com crash
Yesterday I wrote Defensive sectors continue to outperform. Just like the dot-com crash for stocks?
When stating “just like the dot-com crash for stocks”, I don’t mean that stocks are going to crash -50% and high-flying tech stocks are going to crash -80%.
I mean that I think the next bear market and recession will be more similar to the 2000-2002 bear market/recession than the 2007-2009 bear market/recession.
Recency bias explains why so many market watchers are thinking “XYZ is just like 2008, ABC is just like 2008”. In reality, 2008 was a rather rare event. Most recessions and bear markets are more shallow than the 2008 recession and bear market.
But more importantly, various price action & economic indicators suggest that the “next one” will be more similar to 2000-2002: a mild recession and a bigger than -20% bear market
Utilities (defensive stocks) and real estate (RWR – REIT ETF) continue to make new highs while the broad stock market is much weaker.
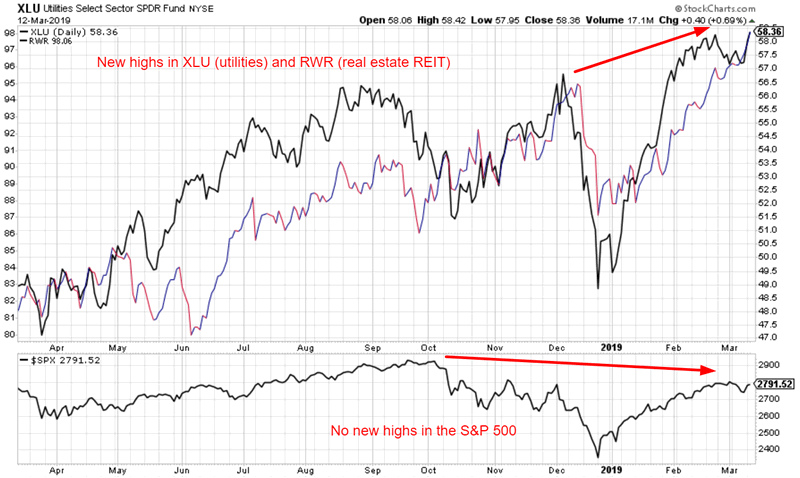
In my mind, this is similar to the 2000 bear market top. 2008 was a systematic crisis – every market went down. But 2000-2002 was different:
- Utilities performed better than the broad index.
- Real estate did very well.
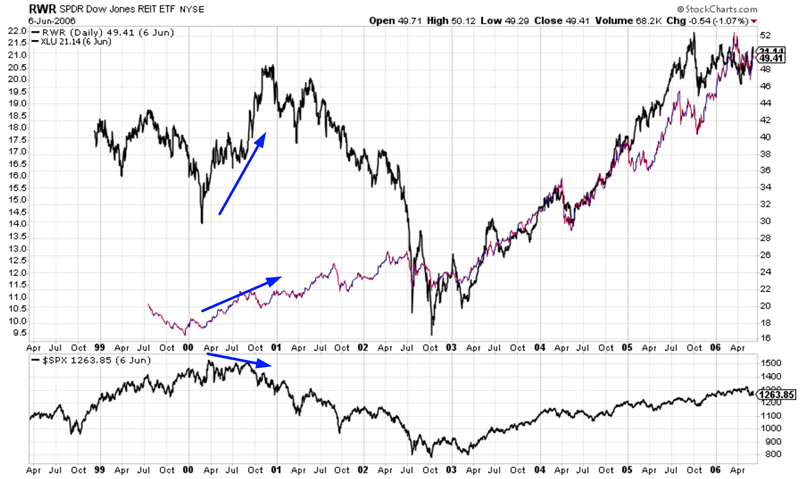
Hence, looking and XLU and RWR “reminds me” of 2000.
Moreover, I can see a case in which real estate does quite well in the next recession. There is a lot of room for housing activity to grow, and demographics support a surge in housing construction/demand over the next half decade.
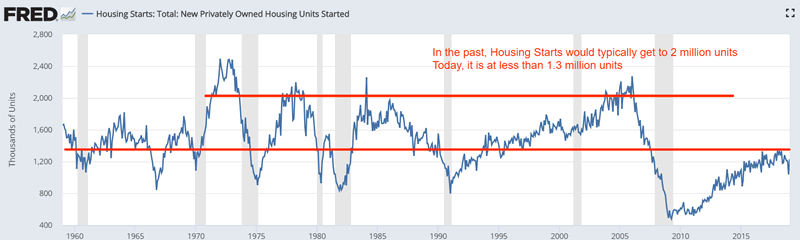
*This is a view that’s supported by Bill McBride from Calculated Risk. If there’s one person you should pay attention to in the finance industry, it’s him. I rarely endorse anyone (and no, I’m not getting paid). Bill is the real deal when it comes to understanding the U.S. economy.
This theory of mine sounds nice and dandy.
Strong utilities (defensive sector) + strong real estate + weak S&P = a recession and bear market like 2000-2002
But am I right? Or is this just a confirmation bias in my mind?
The beauty behind numbers is that you can see if what you believe is true or false.
Here’s what happens next to the S&P when XLU and RWR are at 1 year highs, while the S&P is still more than -4% below its 1 year highs.
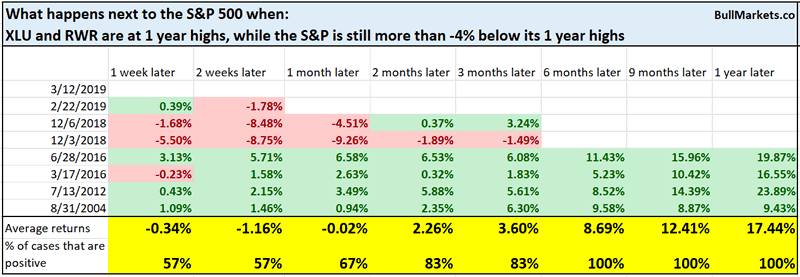
It appears that I was wrong. This is not a consistently long term bearish factor for stocks.
Equal weighted under
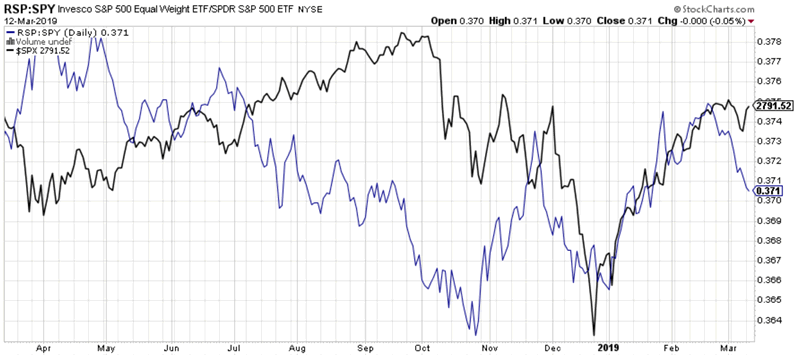
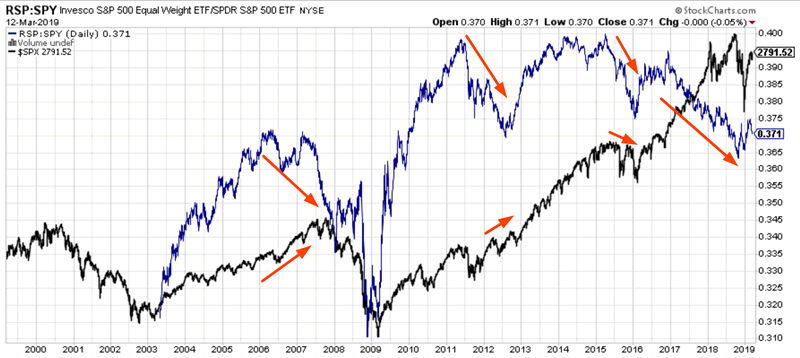
The equal weighted S&P 500 has underperformed the S&P 500 recently. Conventinoal technical traders see this as a bearish sign because it means that “a few large cap stocks are dragging up the market-cap weighted index”. Conventional technical traders want to see “broad participation”.
Here’s the equal weighted vs. market cap weighted S&P 500 ratio (in blue). Notice how this ratio has been falling since mid-February 2019.
 7
7
On a longer term chart, the market cap weighted index has consistently outperformed from 2017 – present. It’s hard to say if this is long term bullish or bearish because n=3. Sample size is too small, and the data is too limited.
- This happened in the runup to 2008. Obviously bearish
- This happened in 2011-2012. Not bearish (a massive rally ensued)
- This happened a little in the runup to 2015. Somewhat bearish.
On a shorter time frame, this is a small (but not extremely consistent) bearish factor.
Here’s what happens next to the S&P when the equal vs. market cap weighted ratio falls more than -0.003, while the S&P rises more than 0.2%
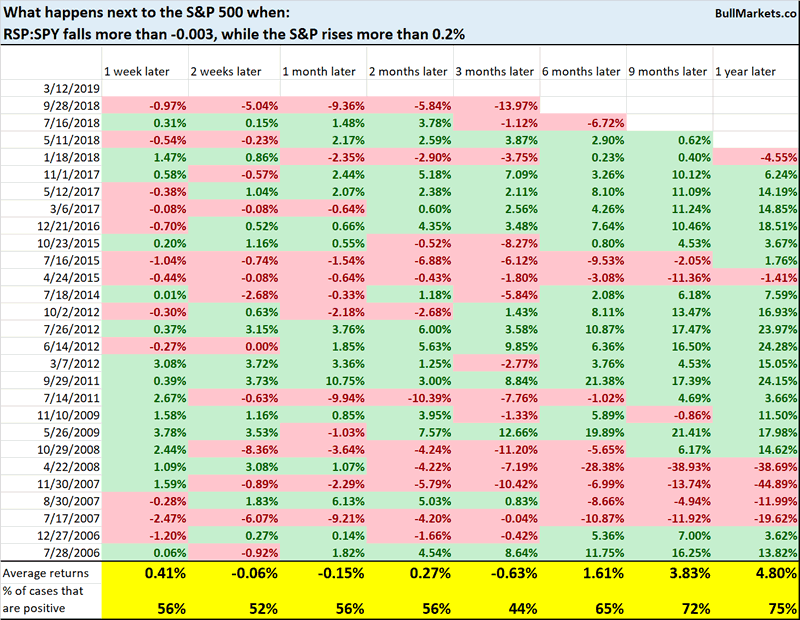
As you can see, this is somewhat of a bearish factor for stocks over the next 3 months. But the figure is close to 50/50, so I wouldn’t bet on it.
Weak yields, corporate bond breakout
Investment grade bonds have finally broken out to new highs for the first time since late-2017.
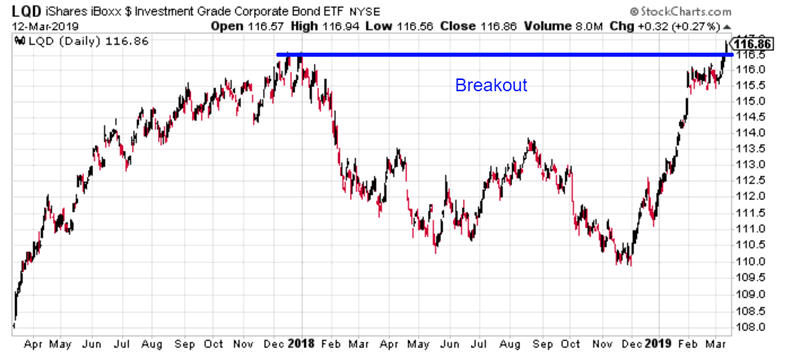
Standard chart/pattern analysis states that these breakouts usually = more upside.
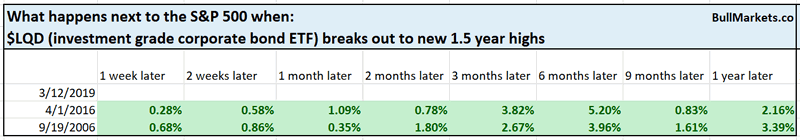
There have only been 2 similar historical cases in which LQD (investment grade corporate bond ETF) broke out after a very long time. Both of these historical cases were bullish. But with n=2, it’s hard to test these breakout patterns seriously.
Jeff Gundlach
Widely followed “bond king” Jeff Gundlach said today that the stock market is still in a bear market. (from CNBC)
Now before you panic, consider the following:
In October 2011, Jeff calls the 2009-2011 rally a “bear market rally” (i.e. part of the greater 2007-2009 bear market).
In late-2012, Jeff predicts “a financial catastrophe coming”.
In 2013, Jeff warns investors against the “euphoria” in stocks.
In 2016, some story, different words
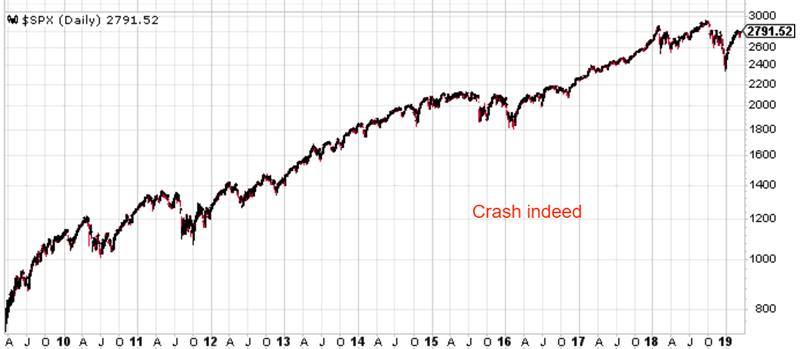
In 2017, from Jeff
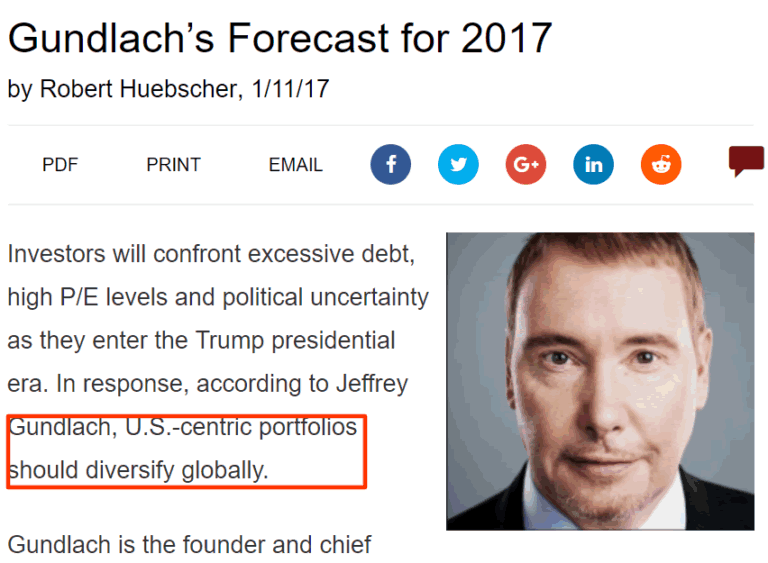
Needless to say, these market calls have been worse than a coin toss.
The point isn’t to pick on Jeff. Maybe Jeff is right this time (if you toss a coin, you will be right 50% of the time as well). The point is:
- You should never be bullish/bearish just because your favorite guru is bullish/bearish. Always look at why they are bullish/bearish. If those reasons don’t make sense to you, then ignore them, regardless of how many billions $ they have. Most stock market experters are basically just smart, high IQ marketers anyways.
- What sounds smart isn’t really smart. Anything related to predicting the future is extremely hard. Experts always come up with a million reasons why they think XYZ will happen in the future. But in reality, the long term track record of “experts” is close to a 50/50 coin toss.
- Always question everything. Don’t take anything at face value. When you read anything (including this website), please don’t trust anything blindly. Only by constantly questioning and doubting can we as humans improve.
*On the issue of Jeff Gundlach himself, his bond market calls are usually spot on, but his stock market calls are terrible (hence why Jeff is called “the bond king” and not the “stock king”). Always search through your favorite guru’s past market calls to see how good he really is.
Click here for yesterday’s market analysis
Conclusion
Here is our discretionary market outlook:
- The U.S. stock market’s long term risk:reward is no longer bullish. In a most optimistic scenario, the bull market probably has 1 year left. Long term risk:reward is more important than trying to predict exact tops and bottoms.
- The medium term direction (e.g. next 6-9 months) is more bullish than bearish.
- The stock market’s short term has a bearish lean due to the large probability of a pullback/retest. Focus on the medium-long term (and especially the long term) because the short term is extremely hard to predict.
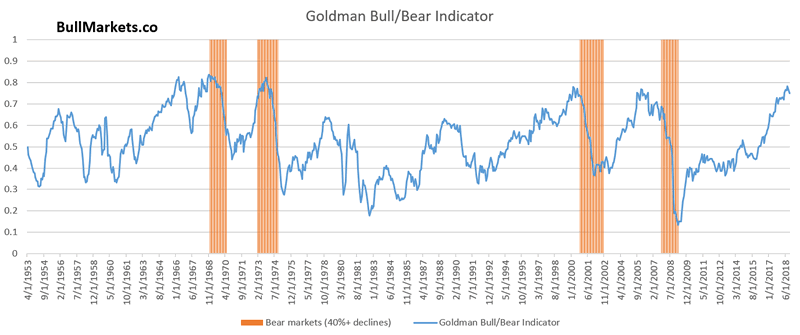
Goldman Sachs’ Bull/Bear Indicator demonstrates that while the bull market’s top isn’t necessarily in, risk:reward does favor long term bears.
Our discretionary market outlook is not a reflection of how we’re trading the markets right now. We trade based on our clear, quantitative trading models, such as the Medium-Long Term Model.
Members can see exactly how we’re trading the U.S. stock market right now based on our trading models.
Click here for more market studies
By Troy Bombardia
I’m Troy Bombardia, the author behind BullMarkets.co. I used to run a hedge fund, but closed it due to a major health scare. I am now enjoying life and simply investing/trading my own account. I focus on long term performance and ignore short term performance.
Copyright 2019 © Troy Bombardia - All Rights Reserved
Disclaimer: The above is a matter of opinion provided for general information purposes only and is not intended as investment advice. Information and analysis above are derived from sources and utilising methods believed to be reliable, but we cannot accept responsibility for any losses you may incur as a result of this analysis. Individuals should consult with their personal financial advisors.
© 2005-2022 http://www.MarketOracle.co.uk - The Market Oracle is a FREE Daily Financial Markets Analysis & Forecasting online publication.