


Phase 1 of Stock Market Correction
Stock-Markets / Stock Markets 2019 Mar 11, 2019 - 05:16 PM GMTBy: Andre_Gratian

 Current Position of the Market
SPX: Long-term trend – Is the long-term trend resuming? Is this a B-wave? Too early to tell!
Intermediate trend – Initial rally has come to an end.
Analysis of the short-term trend is done on a daily basis with the help of hourly charts. It is an important adjunct to the analysis of daily and weekly charts which discusses the course of longer market trends.
Daily market analysis of the short term trend is reserved for subscribers. If you would like to sign up for a FREE 4-week trial period of daily comments, please let me know at ajg@cybertrails.com
Phase 1 of Correction.
Market Overview
SPX Made an initial high at 2813 on 2/25, as did the other three major indexes followed in this letter. On 3/04 it made a slightly higher top, as did NDX, but DJIA and IWM did not and, as all four started to pull back, it became evident that the market was struggling to remain afloat. Even the last optimistic news reports about a positive resolution to the US-China trade situation could no longer keep it in an uptrend. After a brief distribution period the long anticipated correction finally took hold.
The first phase of the correction is likely over after a 94-point decline to 2722. The 5X P&F chart had given a projection count to 2725-30, and this turned out to be spot on. With the initial target met, a countertrend may already have started which should retrace about 50% of phase 1. The odds of this taking place are reinforced by the P&F count taken at the 2530 level. After this rebound is over and another small distribution pattern has formed, we should be ready for phase 2 of what could turn out to be a simple a-b-c correction. The congestion pattern which formed between 2/25 and 3/06 may already given us an inkling of the extent of the entire retracement. After its completion, we will see if the index is able to resume its uptrend, or if more corrective action is required.
Chart Analysis (The charts that are shown below are courtesy of QCharts)
SPX daily chart
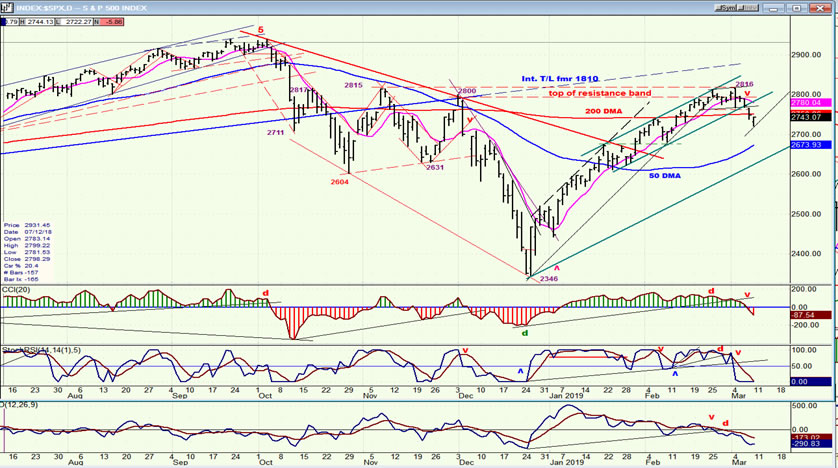
The resistance band held, even though it was slightly exceeded -- but only on an intra-day basis. The daily close did not make a new high! Nevertheless, the fact that we did trade slightly above the previous 2815 high could be an indication that after this correction is over, we will surpass the current high of 2818. An eventual kiss-back to the vicinity of the blue trend line which had its origin at 1810 in January 2016 would cannot be excluded.
I am a strong believer in price channels! There are several on this chart, and one that I had mentioned on several occasions was the one which continued the rally from about the halfway point, but at a lesser angle. I had mentioned before that going through the bottom of that channel would most likely start a correction, and the market was kind enough to oblige. I have drawn another parallel to that channel from the 2346 low. I think that there is a good possibility that the correction will at least continue until it reaches the bottom line of the wider channel.
I had also mentioned that the end of the rally would be confirmed by all three indicators going into the red. Once again, they followed the prescribed order of succession with the A/D (lowest) being first, followed by the SRSI (middle), and finally the CCI which did not become negative until last Thursday. Now they will have to do it all in reverse to give us the next buy signal. I suspect that this will take another good week and a half to two weeks to accomplish, at least.
SPX hourly chart
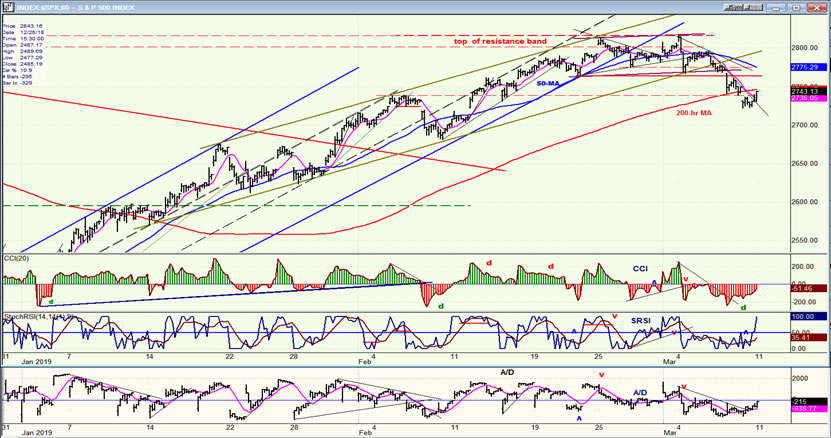
Even though prices slowly gravitated toward the lower line of the initial (blue) channel in an apparent deceleration pattern which created the secondary (green) channel, it was not until they finally moved outside of the blue channel entirely that we had our first warning that a reversal was about to take place. And it took a couple of weeks more before prices moved outside of the green channel, and the correction did start. Prices tried to hold at the support level created by the top of the early February short-term top (red dashed line), but they were pushed lower on Friday morning when a poor jobs report was announced. Even the support added by the 200-hr MA could not fend off the selling that took place Friday. However, the extra push could not erase the positive divergence that had already appeared on the CCI and in the A/Ds by Thursday’s close, and by the end of Friday, the index had already started an oversold rally . Actually, the term “oversold” is a misnomer since prices already knew where to go guided by the P&F count. On Thursday, they were still short of that target.
It is not clear whether we keep going up right away on Monday. The A/Ds were still negative at Friday’s close, as was the CCI. The index was also still under the 200-hr MA which could offer temporary resistance, but the fact that we have already overcome the short-term downtrend line might be enough to bring in buyers first thing Monday.
DJIA, SPX, IWM, NDX (daily)
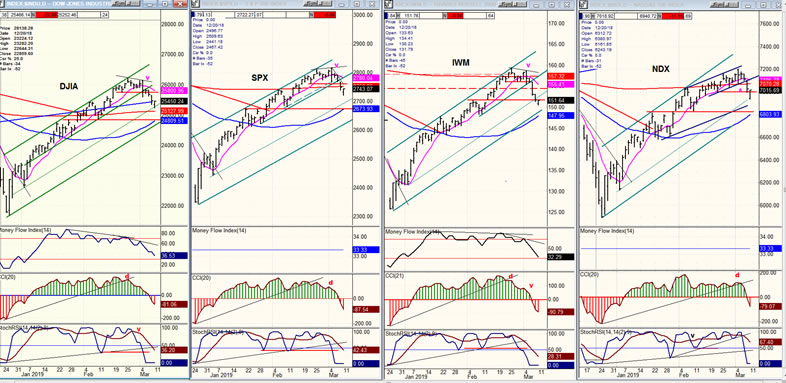
I think that it is fairly clear that we have started a correction. All four indexes have turned down, although the amount of weakness in NDX makes that questionable for this index; but there is no question that its indicators have given a sell signal. Since this is obviously the beginning of a correction, we need to give it time to define itself more clearly. At the end of the week, there was nothing pointing to its end, and IWM was a little weaker than the others, so let’s take it a week at a time.
UUP (Dollar ETF) (daily)
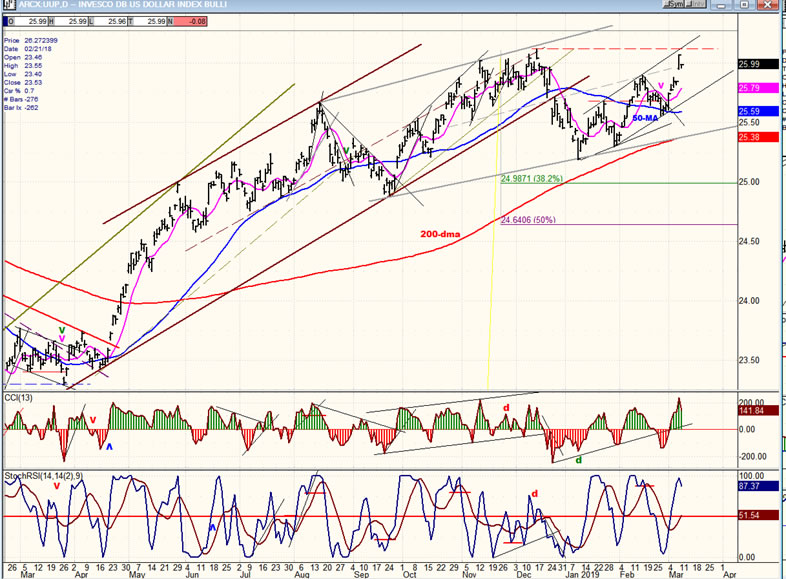
After holding above its 50-DMA, UUP has now come within a few cents of its recent high. Since it has gone to the top of its short-term channel, it could consolidate before attempting to move higher. The fact that it did go as far as it could within the price channel shows a lack of deceleration, and therefore at least the possibility that it will try for a new high after a little pull-back.
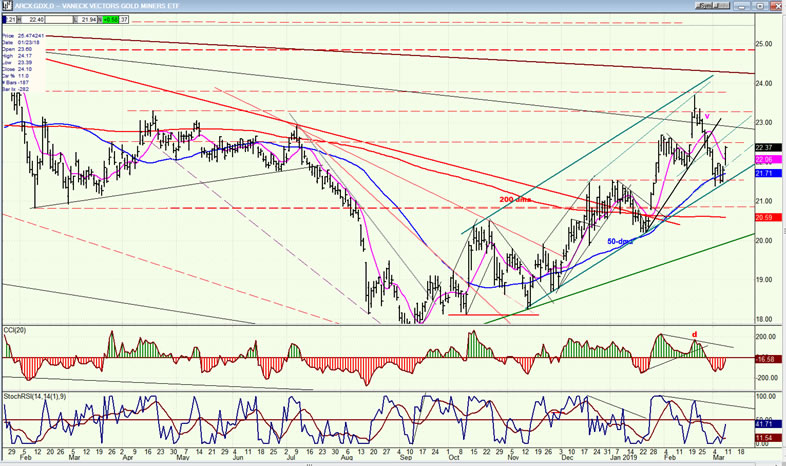
GDX (Gold miners ETF) (daily)
After making a new short-term high which also reached to the top of its price channel, GDX displayed enough weakness to retrace the entire width of that broad channel. It found obvious support on the trend line and is bouncing, but the extent of the correction over such a short period of time points to more than casual profit-taking. The odds that it will move outside of its channel and extend its correction are pretty good, right now.
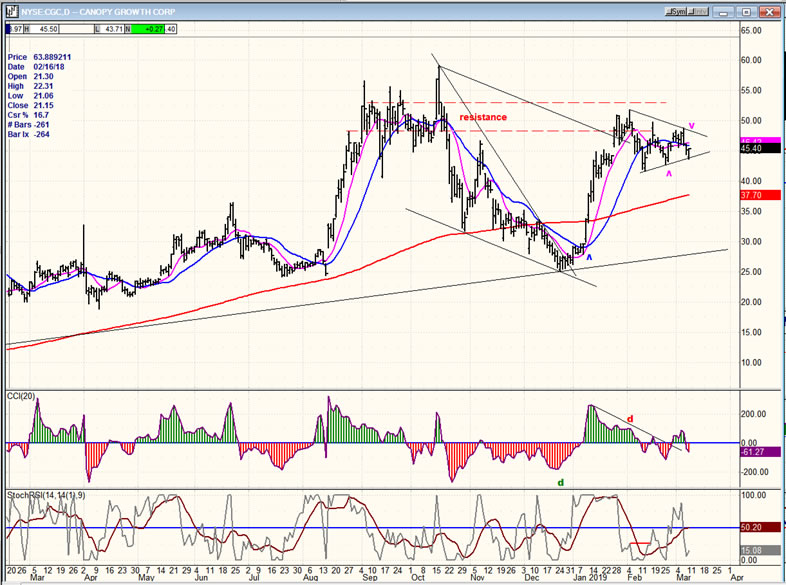
CGC (Canopy Growth) (daily)
CGC continues to consolidate in what appears to be a triangle pattern. If correct, it should now be ready to move out of it on the upside. Further price deterioration would invalidate the triangle and suggest that another, longer consolidation pattern is in the making. If it can continue to move higher as the market corrects, it would be further evidence of that group’s relative strength.
BNO (United States Brent Oil Fund) (daily)
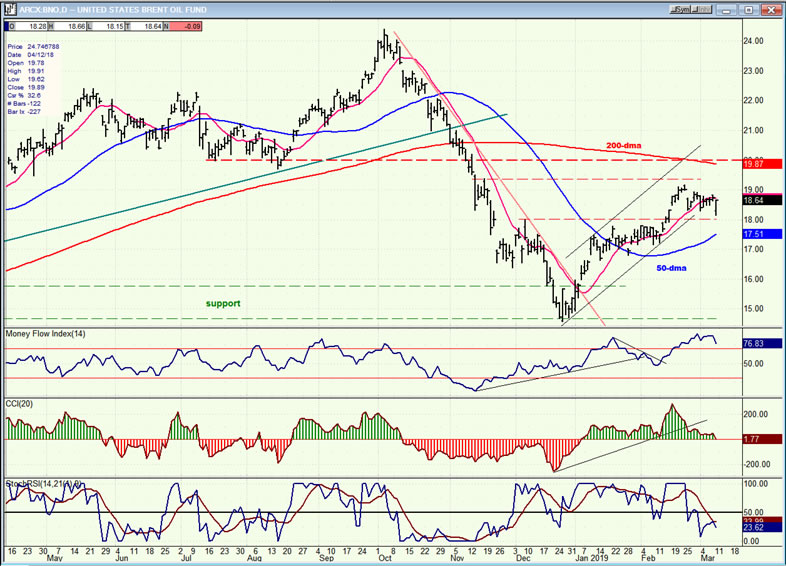
BNO still looks as if it is getting ready to push a little higher before ending its rally. It has good support at 18.00, and Friday’s action could be the start of the rally’s extension into the zone of resistance above.
Summary
After an impressive rally from its “bear market” low of 2346, SPX is finally ready to correct that advance. Last week’s decline to 2725 probably ended the first phase of that correction, and the index may already have started a countertrend move to retrace part of that initial 94 point drop. After a short rebound, one should look for an extension of the decline. Let’s turn this over to the indicators and let them “indicate” when the correction is coming to an end.
Andre
FREE TRIAL SUBSCRIPTON
With a trial subscription, you will have access to the same information that is given to paid subscribers, but for a limited time period. I think you will find that knowing how far a move can carry is one of the most useful benefits of this service, whether you are a trader or an investor -- especially when this price target is confirmed by reliable indicators which give advance warning of a market top or bottom. Furthermore, cycle analysis adds the all- important time element to the above price projections.
For a FREE 4-week trial, further subscription options, payment plans, and for general information, I encourage you to visit my website at www.marketurningpoints.com.
Disclaimer - The above comments about the financial markets are based purely on what I consider to be sound technical analysis principles uncompromised by fundamental considerations. They represent my own opinion and are not meant to be construed as trading or investment advice, but are offered as an analytical point of view which might be of interest to those who follow stock market cycles and technical analysis.
Andre Gratian Archive |
© 2005-2022 http://www.MarketOracle.co.uk - The Market Oracle is a FREE Daily Financial Markets Analysis & Forecasting online publication.