


What Commodities and Transportation Stocks Are Telling Us
Stock-Markets / Stock Markets 2019 Mar 05, 2019 - 05:14 PM GMTBy: Chris_Vermeulen

 Our ongoing efforts to dissect these markets and to help educated and inform traders has led us on an exploration path into the general market activities of two leading market indicators; Commodity prices and Transportation Prices. These two core elements of any regional or global economy are usually about 3~6 months ahead of the general markets. When viewing the Transportation Index, remember that transportation is key to any growing economy and a healthy economy. When an economy is doing well, the transportation sector will be busy shipping and delivering consumer product and staples as well as manufacturing equipment and supplies. When viewing the Commodity Index, remember the Supply and Demand equation where greater demand for commodities needed to manufacture, create, deliver or sell a product will drive prices higher as supply remains relatively constant, prices will increase.
Therefore, the theory of today’s research post is “are Transportation and Commodity prices telling us anything important about the future stock market valuations?”. Let’s get into the research.
First, the NASDAQ Transportation Index is painting a very clear picture that the upside price move starting near the end of 2016 drove prices well above historical normal ranges. Even today, we are well above historical ranges originating from the lows in 1998 and including the range expansion from the highs of 2007 to the lows of 2009. Given the premise that the Transportation Index would be highlighting increased economic activities across the planet and particularly those of more mature economies, one should expect that global trade/economic activity should be near all-time highs.
We would like to point out a defined upward price slope, highlighted by the RED LINE on this chart. We believe any potential downside price swing will find clear support near the $5025 level (the first upper range level from historic deviation ranges) or near $4690 (the RED LINE support channel).
![]()
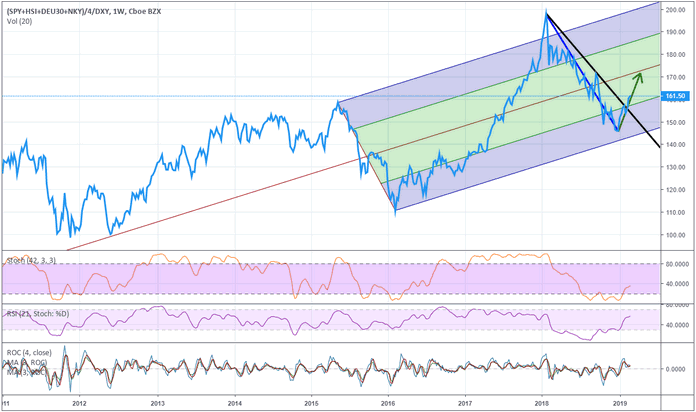
In order to further our research, we’ll take a look at our “Custom Smart Cash Index” which highlights a broad range of global market indexes and weights them in a US Dollar basis. Obviously, the results of this Smart Cash Index is designed to highlight the total global valuation levels of a variety of mature economies/markets. We can easily see the volatility range established by the concerns prior to the 2016 US Presidential Elections created a very deep volatility range. We believe this is important because it establishes a “relative high point” and a “relative low point” that reflects human psychology and expectations. In other words, we believe the high point in early 2015 reflects an optimistic investor sentiment and the low point in early 2016 reflects a pessimistic investor sentiment.
This range can help us determine if current Smart Cash valuations are reflecting optimistic or pessimistic expectations by determining if the current price is near the lower areas of this range or the upper areas of this range.
Currently, the Smart Cash Index is moving higher after reaching an ultimate low point near December 24, 2018. This would indicate that optimism is increasing in the global markets. Additionally, The Smart Cash Index has breached a downward sloping price channel, drawn in BLACK. We believe continued optimism will drive global market valuations higher over time. Yet, we believe numerous 4~7%+ price rotations will occur in the US Stock Market as the total valuations continue to rise over the next 12~24 months.
What we would expect to find to help confirm our analysis is the price levels of general commodities would be increased to match the renewed optimism we believe is growing in the global markets. Obviously, if the global economies are doing well and trade/sales are increasing, then we would expect core commodity levels to increase as demand stays strong which we have seen this happen time and time again during economic cycles.
This concludes PART I and how we identify market opportunities for us to trade. Analysis like this has allowed us to generate substantial profits in the past 30 days with UGAZ 30%, NIO 21.6%, ROKU 18%, GDXJ 10.5%. IF you want to know our conclusion on what commodities and transports are telling us then visit our website to read PART II in the next 24 hours.
If you want to learn how we can help you find success throughout this shifting market and throughout 2019 and beyond, then visit www.TheTechnicalTraders.com to learn how we help our members create success.
Chris Vermeulen
www.TheTechnicalTraders.com
Chris Vermeulen has been involved in the markets since 1997 and is the founder of Technical Traders Ltd. He is an internationally recognized technical analyst, trader, and is the author of the book: 7 Steps to Win With Logic
Through years of research, trading and helping individual traders around the world. He learned that many traders have great trading ideas, but they lack one thing, they struggle to execute trades in a systematic way for consistent results. Chris helps educate traders with a three-hour video course that can change your trading results for the better.
His mission is to help his clients boost their trading performance while reducing market exposure and portfolio volatility.
He is a regular speaker on HoweStreet.com, and the FinancialSurvivorNetwork radio shows. Chris was also featured on the cover of AmalgaTrader Magazine, and contributes articles to several leading financial hubs like MarketOracle.co.uk
Disclaimer: Nothing in this report should be construed as a solicitation to buy or sell any securities mentioned. Technical Traders Ltd., its owners and the author of this report are not registered broker-dealers or financial advisors. Before investing in any securities, you should consult with your financial advisor and a registered broker-dealer. Never make an investment based solely on what you read in an online or printed report, including this report, especially if the investment involves a small, thinly-traded company that isn’t well known. Technical Traders Ltd. and the author of this report has been paid by Cardiff Energy Corp. In addition, the author owns shares of Cardiff Energy Corp. and would also benefit from volume and price appreciation of its stock. The information provided here within should not be construed as a financial analysis but rather as an advertisement. The author’s views and opinions regarding the companies featured in reports are his own views and are based on information that he has researched independently and has received, which the author assumes to be reliable. Technical Traders Ltd. and the author of this report do not guarantee the accuracy, completeness, or usefulness of any content of this report, nor its fitness for any particular purpose. Lastly, the author does not guarantee that any of the companies mentioned in the reports will perform as expected, and any comparisons made to other companies may not be valid or come into effect.
Chris Vermeulen Archive |
© 2005-2022 http://www.MarketOracle.co.uk - The Market Oracle is a FREE Daily Financial Markets Analysis & Forecasting online publication.