


Stock Traders Must Be Cautious Part III
Stock-Markets / Stock Markets 2019 Feb 22, 2019 - 04:44 PM GMTBy: Chris_Vermeulen

 Welcome back, If you’ve missed any part of this multi-part research post, please visit www.TheTechnicalTraders.com/FreeResearch/ to review and read our previous posts. This, Part III, of our multi-part research post where we are attempting to rationalize the continued bearish analysis of some other analysts as well as review some key data that may support our interpretation that the global markets are transitioning through a “revaluation phase” right now – headed for a breakout rally eventually will continue with more detailed information. Our premise is that global investors and traders should stay cautiously optimistic at the moment and prepare for some volatility as this “revaluation phase” continues to play out. Our overall analysis suggests that the US Federal Reserve and global central banks have “primes the cylinders” of the global economic engine sufficiently and that a spark is all that is needed to see massive new valuation and GDP increases within the next 10~20+ years.
Within the previous sections of this article, we’ve discussed how Globalization has expanded and normalized the global economic activities over the past 50+ years. We’ve also discussed how this process of globalization has created a series of crisis events as localized central banks are now dealing with total globalization and the new risks that are associated with this transition. Our position is that the economies of the planet are now more interconnected than ever before and, thus, the concept of a massive collapse event is less likely than ever before. The only way a massive collapse event could take place, in our opinion, would be a global war between super-economies or a total collapse of multiple super-economies because of some catalyst event. Otherwise, we believe the proper thinking is that of a “revaluation phase” not a “collapse event”.
Let’s dig further into the data and continue our research.
In the past, we’ve suggested that capital operates like a living organism, always in search of the healthiest environment to reside within and always attempting to identify and mitigate risk factors where they reside. In other words, global capital is always seeking out the best, safest and most secure (immune from risk) returns possible at all times. The recent globalization process creates a unique environment where capital can “transition” from one global market to another in an instant. Risks can be identified and mitigated within minutes, hours or days now where, in the past, these risks could have been catastrophic in nature.
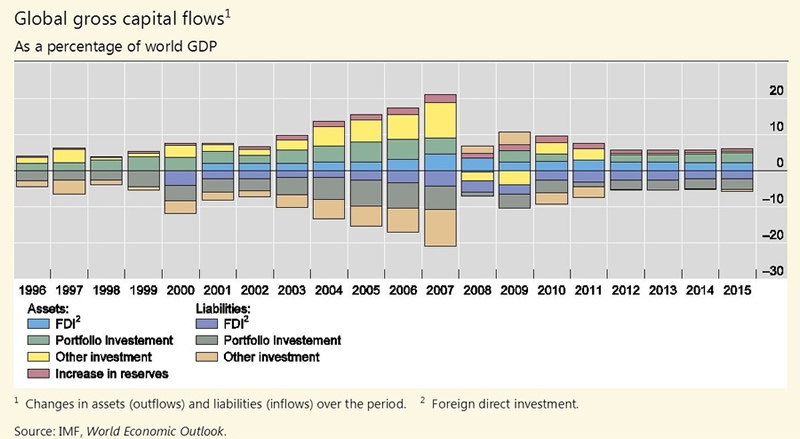
Within this new “instant” environment for capital and global markets, new risks persist. Because huge amounts of capital can now move freely across global platforms and economies, volatility is likely to continue at 2x to 5x historical norms. This also means that catastrophic regional economic events will likely result in more severe price rotation and speculation. The end result is that capital is now flowing across the planet more efficiently than ever before and this creates a whole new playing field for investors and traders.
Consider the Global Gross Capital Flows below and pay very close attention to the change in how capital moved and was deployed prior to 2008 and on/after 2008. If you read this chart as our research team sees it, we have entered a period (from 2000 onward) where massive amounts of capital have been dumped into the global markets. Much of this capital has been deployed into infrastructure and supporting global banking and credit markets over the past 18+ years. Yet a very large portion of this capital has yet to become fully activated in the global markets and this can clearly be seen by the reduced GDP output on this graph. 2015 Global GDP levels have dramatically changed and are very near pre-2001 levels in scale.
As readers of this article, the point we are trying to make is that “the guns are primed, loaded, aimed and ready for BUSINESS”. The collapse of global GDP, which is clearly evident in the past few graphs we’ve presented, began to become clearly evident in 2014~2015. An interesting facet of this contraction was that China instituted new Capital Outflow laws to attempt to prevent investment capital from rushing out of local Chinese markets at this same time. The purpose of this was a protectionary move by China attempting to support their local credit markets and internal banking markets. Unlike other global markets, China could not risk having large amounts of capital rush overseas (depleting repayment capabilities and local coffers) while continuing to build and pump up their credit/lending markets. They had not considered the risks that Chinese investors/Entrepreneurs would take large components of their new wealth and aggressively move it outside the Chinese market. Shortly after that, came the 2016 US presidential elections – which always present some level of rotation/contraction within the markets.
(Source: https://www.jvi.org/special-events/2016/global-drivers-and-effects-of-capital-flows.html)
As we move forward with this data and the key question we posed at the very beginning; are the Doomsayers right? Do you believe the markets will collapse in the immediate future or do you believe the global markets are poised and primed for another massive price advance because of the massive influx of capital that has recently been dumped into the markets?
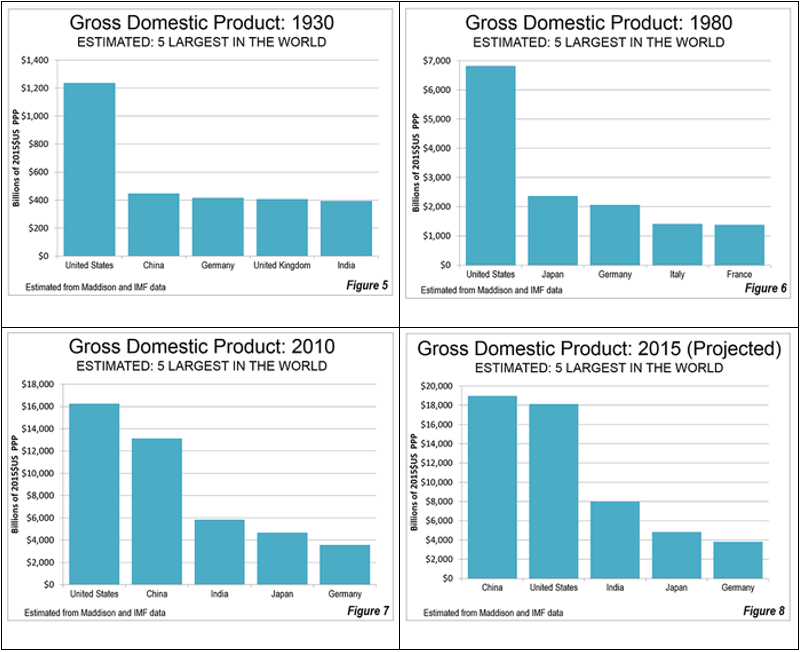
Let’s try to answer some of these questions by presenting clear data in regard to how the global markets have changed over the past 90+ years. The GDP data below shows how different nations have rallied GDP output over the past 90+ years and how the dynamics of the global markets are taking root. Remember the data we’ve presented earlier when you review these GDP graphs, below. Remember that from 1970 till now, the US Federal Reserve and global central banks have poured over $40 Trillion US Dollars into the global markets and this capital is working through the banking system and economies in an attempt to solidify growth/return opportunities.
(Source:http://www.newgeography.com/content/005050-500-years-gdp-a-tale-two-countries)
If we were to total the GDP of the Top 5 economies on the planet for each of these graphs, the numbers would like something like this :
__ 1930: $2.87 Trillion Annually
__ 1980: $14.16 Trillion Annually
__ 2010: $43.84 Trillion Annually
__ 2015: $53.82 Trillion Annually
As we’ve seen from the previous data, the creation of capital by the central banks take a bit of time to settle into the global economies to begin producing real GDP advancements. Additionally, we believe the 2009~2014 global credit market crisis was one of the biggest crisis events to “re-sync” the global markets in decades. This event was similar to the 1929 US stock market crash in combination with the wars of the 1930s and early 1940s rolled all into one. The primary difference between now and then is the fact that global economies are now very inter-connected and what took many decades in the past now takes only a few short years to recover.
What should we expect in the future and why are we cautiously optimistic about the next 2~5+ years, keep reading our next segment to find out. We’ve covered almost all of the key data points that highlight what has transitioned in the past 40~50+ years. Next, we’ll highlight why we are very optimistic that 2019 and 2020 will be incredible years for skilled traders and investors and we’ll show you what to expect from the US markets going all the way into 2021.
Isn’t it time you considered joining a group of professional traders, researchers, and friends to help you find and execute greater success in the future? Then visit www.TheTechnicalTraders.com to learn how we can help you find and execute better trades. Take a look at some of our recent winners to see how we help people, just like you, create success. We believe 2019 and 2020 will be incredible years for skilled traders and we are executing at the highest level we can to assist our members. In fact, we are about to launch our newest technology solution to better assist our members in creating future success. Isn’t it time you invested in your future success by joining a team of professionals dedicated to giving you an advantage in the markets every day?
Chris Vermeulen
www.TheTechnicalTraders.com
Chris Vermeulen has been involved in the markets since 1997 and is the founder of Technical Traders Ltd. He is an internationally recognized technical analyst, trader, and is the author of the book: 7 Steps to Win With Logic
Through years of research, trading and helping individual traders around the world. He learned that many traders have great trading ideas, but they lack one thing, they struggle to execute trades in a systematic way for consistent results. Chris helps educate traders with a three-hour video course that can change your trading results for the better.
His mission is to help his clients boost their trading performance while reducing market exposure and portfolio volatility.
He is a regular speaker on HoweStreet.com, and the FinancialSurvivorNetwork radio shows. Chris was also featured on the cover of AmalgaTrader Magazine, and contributes articles to several leading financial hubs like MarketOracle.co.uk
Disclaimer: Nothing in this report should be construed as a solicitation to buy or sell any securities mentioned. Technical Traders Ltd., its owners and the author of this report are not registered broker-dealers or financial advisors. Before investing in any securities, you should consult with your financial advisor and a registered broker-dealer. Never make an investment based solely on what you read in an online or printed report, including this report, especially if the investment involves a small, thinly-traded company that isn’t well known. Technical Traders Ltd. and the author of this report has been paid by Cardiff Energy Corp. In addition, the author owns shares of Cardiff Energy Corp. and would also benefit from volume and price appreciation of its stock. The information provided here within should not be construed as a financial analysis but rather as an advertisement. The author’s views and opinions regarding the companies featured in reports are his own views and are based on information that he has researched independently and has received, which the author assumes to be reliable. Technical Traders Ltd. and the author of this report do not guarantee the accuracy, completeness, or usefulness of any content of this report, nor its fitness for any particular purpose. Lastly, the author does not guarantee that any of the companies mentioned in the reports will perform as expected, and any comparisons made to other companies may not be valid or come into effect.
Chris Vermeulen Archive |
© 2005-2022 http://www.MarketOracle.co.uk - The Market Oracle is a FREE Daily Financial Markets Analysis & Forecasting online publication.