


Is the Stocks Bull Market Over? Or Will There be 1 More Year like 1999?
Stock-Markets / Stock Markets 2019 Jan 23, 2019 - 07:54 AM GMTBy: Troy_Bombardia

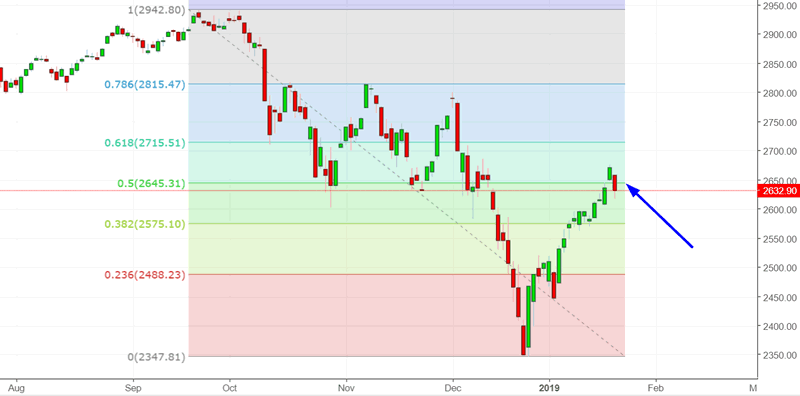
With the S&P 500 at its 50% retracement, many traders are looking for a pullback/retest. The bigger question is what happens next after the pullback/retest. Will there be 1 final leg in the bull market, like 1999? Or is the bull market already over?
Go here to understand our fundamentals-driven long term outlook.
Let’s determine the stock market’s most probable medium term direction by objectively quantifying technical analysis. For reference, here’s the random probability of the U.S. stock market going up on any given day.

*Probability ≠ certainty. Past performance ≠ future performance. But if you don’t use the past as a guide, you are blindly “guessing” the future.
1 more leg?
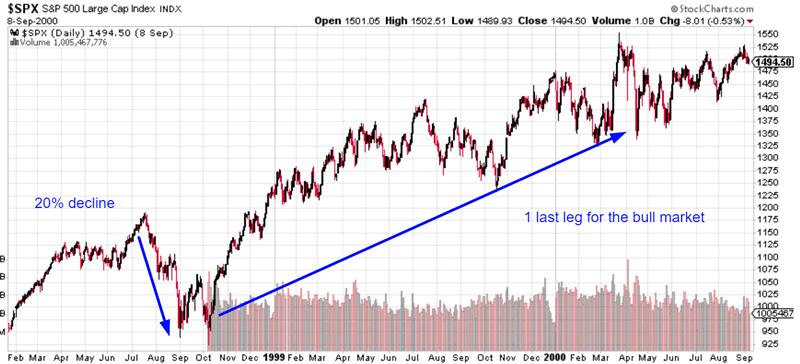
A lot of people are wondering if the bull market is already over, or if it has 1 more leg like 1998-1999
(The S&P fell -20% in 1998. Everyone at the time thought the bull market was over, but it kept on making new highs for 1 more year).
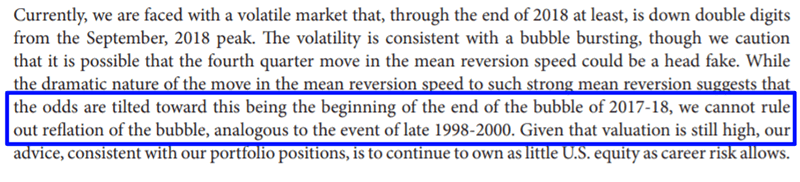
This is a question that Jeremy Grantham’s GMO raised as well. While they recognize the probability of a “1 last bull market leg”, they think it’s more likely that the bull market is already over.
*This is the problem towards the end of a bull market. No matter what kind of analysis you use, you don’t know with 100% certainty if there will be 1 last leg in the bull market or not. Anyone who tells you that they know with 100% certainty “the bull market is over” or “the bull market isn’t over” is lying.
You don’t need a complicated model like GMO’s to tell you that a 1998-2000 final rally scenario is less likely.
Here are some key differences between 1998 and today.
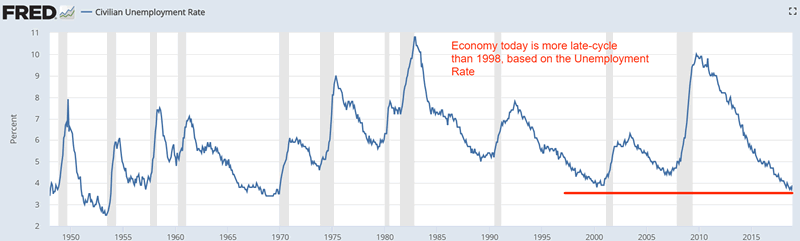
For starters, the unemployment rate today is lower than where it was in 1998. The economy is more “as good as it gets”.
*In September 1998 and today, the Unemployment Rate Model went to cash for 1 month, just like right now. So in this regards 1998 and today are similar.
*If you haven’t read the 13.2% trading model already, please see it here. This simple model beats 95% of market commentators, most of whom can’t beat buy and hold.
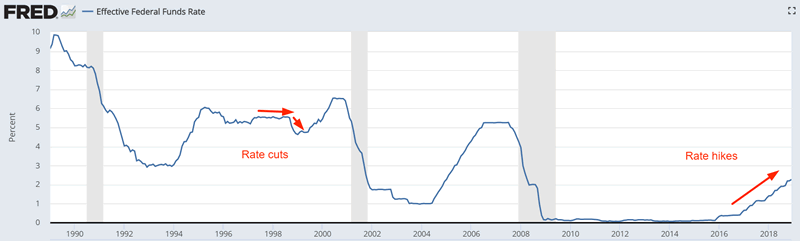
The Fed is hiking interest rates today, vs. cutting interest rates in 1998.
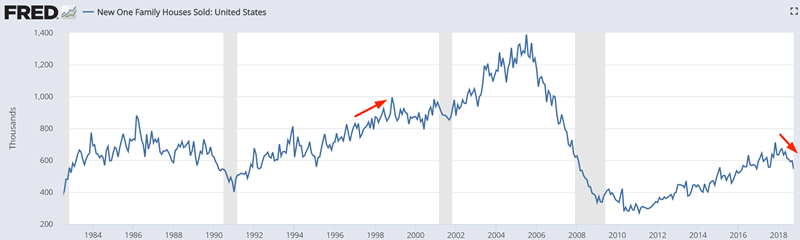
A key leading sector of the economy – housing – was improving in 1998. It is deteriorating today.
All in all, macro data leans towards the top already being in rather than a 1998-case. This isn’t set in stone. If macro starts to improve again, then a 1998-1999 finally rally scenario becomes more likely. Wait and watch the data.
Either way, late-cycle. If you’re a long term investor, now is not the time to buy and hold.
Earnings season and February
Most companies have beat their earnings estimates so far this earning season. But that was because the bar (expectations) were already set very low, making a “beat” very easy.
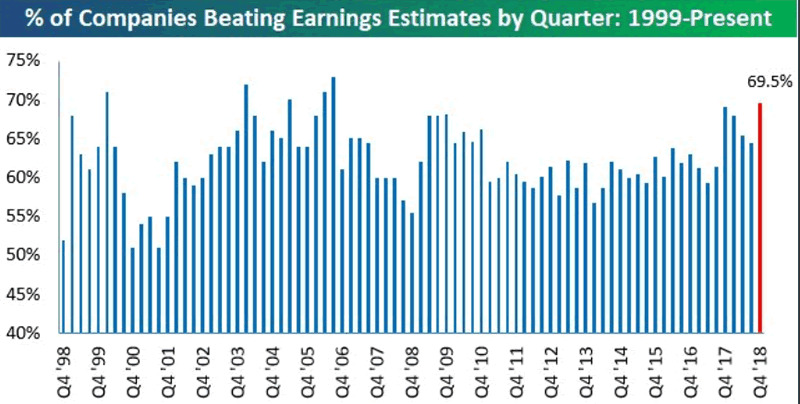
It’s easier for companies to game earnings than revenues, due to accounting rules. While most companies beat their earnings expectations, the % of companies beating revenue expectations is quite low.
*Chart from Bespoke
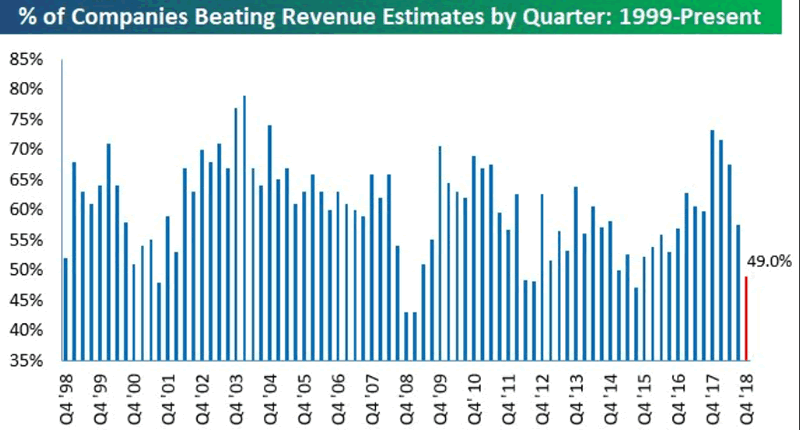
On the surface this seems like a bearish sign for stocks. But when you look at the chart more closely, you can see that it’s not necessarily a bearish sign. A low “% of companies that beat revenues expectations” happens in almost every 15%+ decline. In other words, this is more of a coincident indicator than a leading indicator for the stock market.
- 1998
- 2000
- 2008-2009
- 2011
- 2015
- Q4 2018
Bloomberg noted that companies that missed expectations are being punished more than usual.
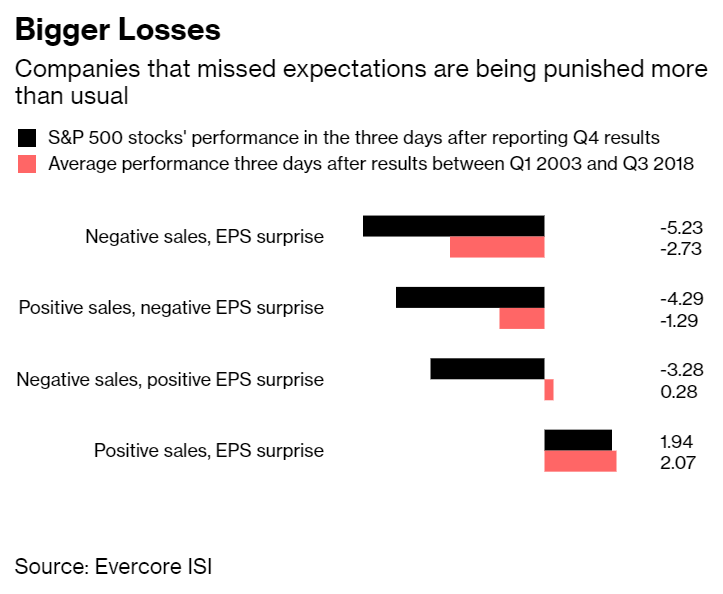
So if disappointing earnings are being punished more than normal, why is the broad stock market going up this earnings season? Because most stocks are still beating their earnings expectations.
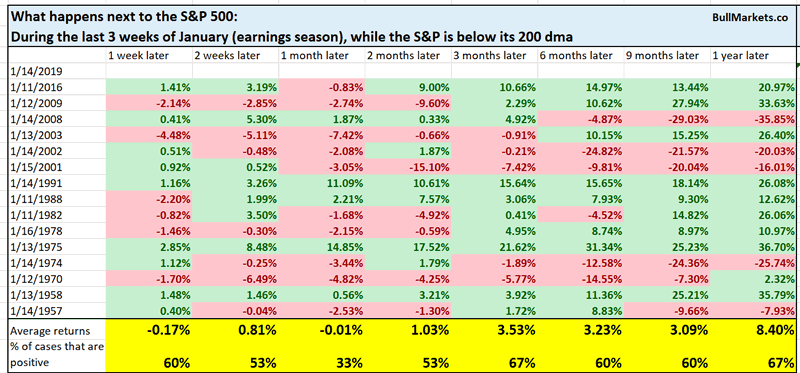
Last week I said that the final 3 weeks of January tend to be ok for stocks, but then stocks deteriorate after earnings season.
Let’s look at February (post-earnings season) more closely.
Here’s what happens to the S&P in February when the S&P is below its 200 dma (i.e. in a downtrend)
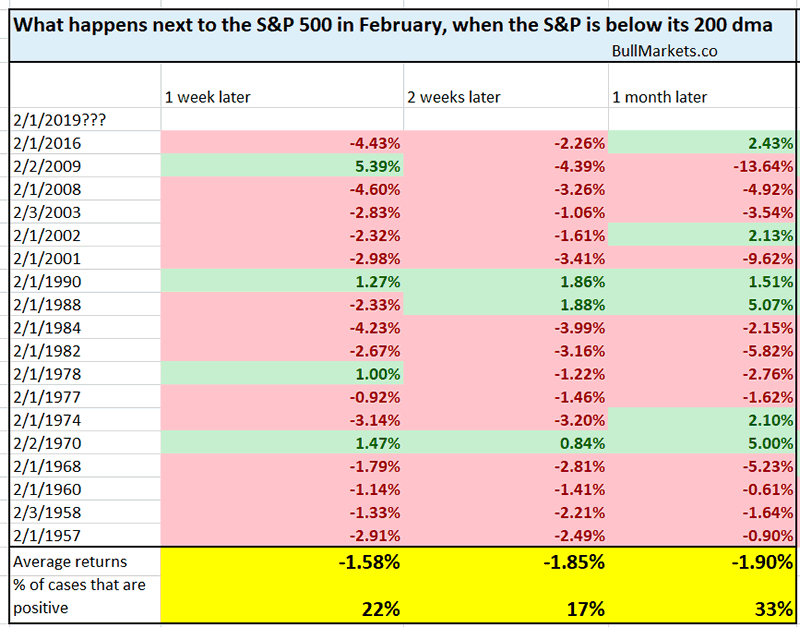
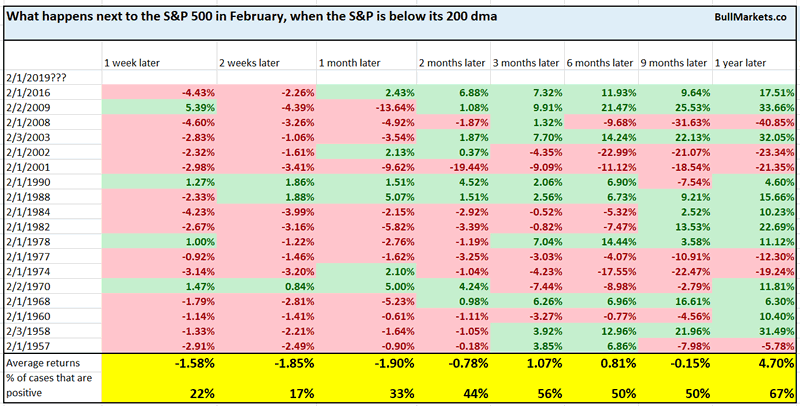
As you can see, the stock market has a heavy bearish lean in the first half of February. Absent the support of corporate earnings, stocks tend to fall in the short term.
*This is what happened in February 2018. Stocks held up fine throughout earnings season in January, and then cratered in February.
S&P Advance-Decline Line
The S&P Advance-Decline line is a breadth indicator. Towards the end of bull markets, the Advance-Decline line will flatten or trend lower as the stock market trends higher. This happened in:
- 1999-2000
- 2007
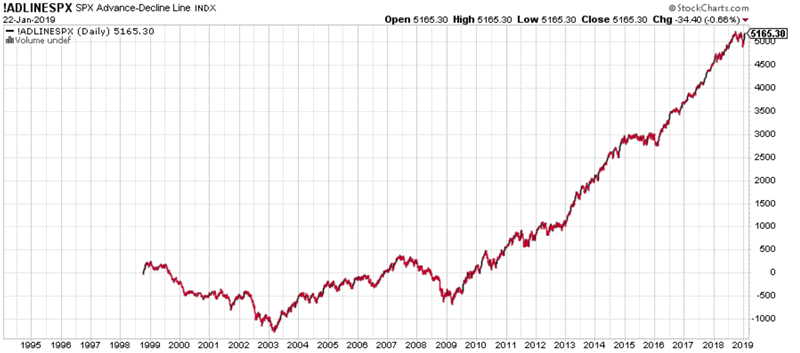
The Advance-Decline line is close to making new all-time highs right now even though the S&P is still more than -8% below its all-time high.
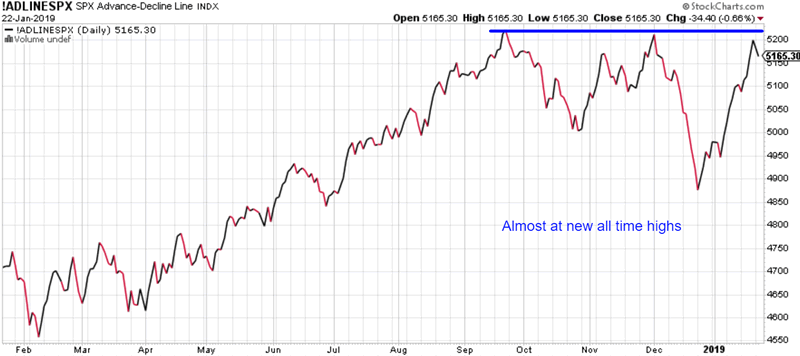
Is this a bullish sign for stocks?
Here’s what happens next to the S&P 500 when the S&P 500 Advance-Decline Line is within 1% of 1 year highs, while the S&P itself is more than -8% below 1 year highs.
*Data from 1998 – present
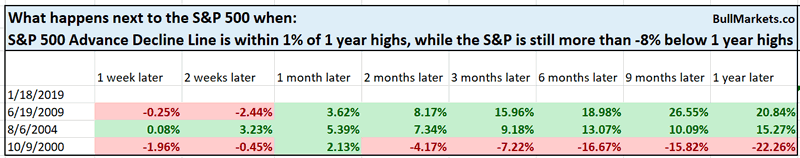
As you can see, this is quite rare, and usually marks long term inflection points in the stock market. (You can see that the 1 year forward returns are either very bullish or very bearish).
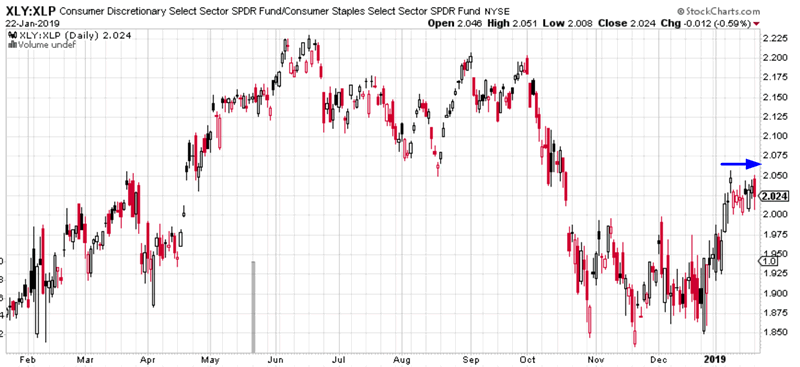
Consumer discretionary vs. Consumer Staples
- XLY = consumer discretionary ETF
- XLP = consumer staples ETF
In a healthy rally, the S&P 500 will go up and the XLY:XLP ratio will go up at the same time.
But over the past 2 weeks, the S&P has gone up while XLY:XLP hasn’t. Is this a bearish sign for stocks?
Here’s what happened next t othe S&P 500 when the S&P went up more than 2% over the past 10 days, while XLY:XLP fell
*Data from 1998-present
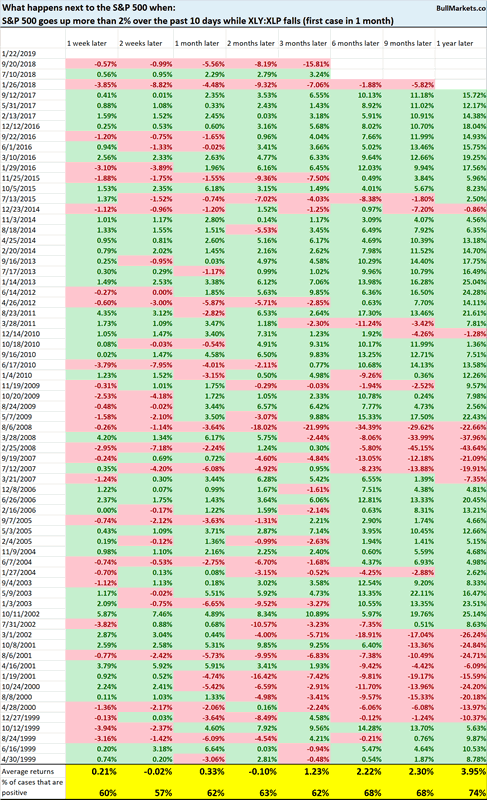
As you can see, this is not consistently bearish or bullish for stocks on any-time frame.
Macro Context
There’s a first time for everything
From 1962 – present, this is the first time in which the S&P went up 11 days in a row (from daily OPEN to daily CLOSE) and then fell more than -1% the next day.
Click here for yesterday’s market study
Conclusion
Here is our discretionary market outlook:
- The U.S. stock market’s long term risk:reward is no longer bullish. This doesn’t necessarily mean that the bull market is over. We’re merely talking about long term risk:reward. Long term risk:reward is more important than trying to predict exact tops and bottoms.
- The medium term direction (i.e. next 3-6 months) is neutral. Some market studies are medium term bullish while others are medium term bearish
- The stock market’s short term has a bearish lean due to the large probability of a pullback/retest. Focus on the medium-long term (and especially the long term) because the short term is extremely hard to predict.
A simple trading model that yields 13.2% per year has turned long term bearish for the first time since 2009.
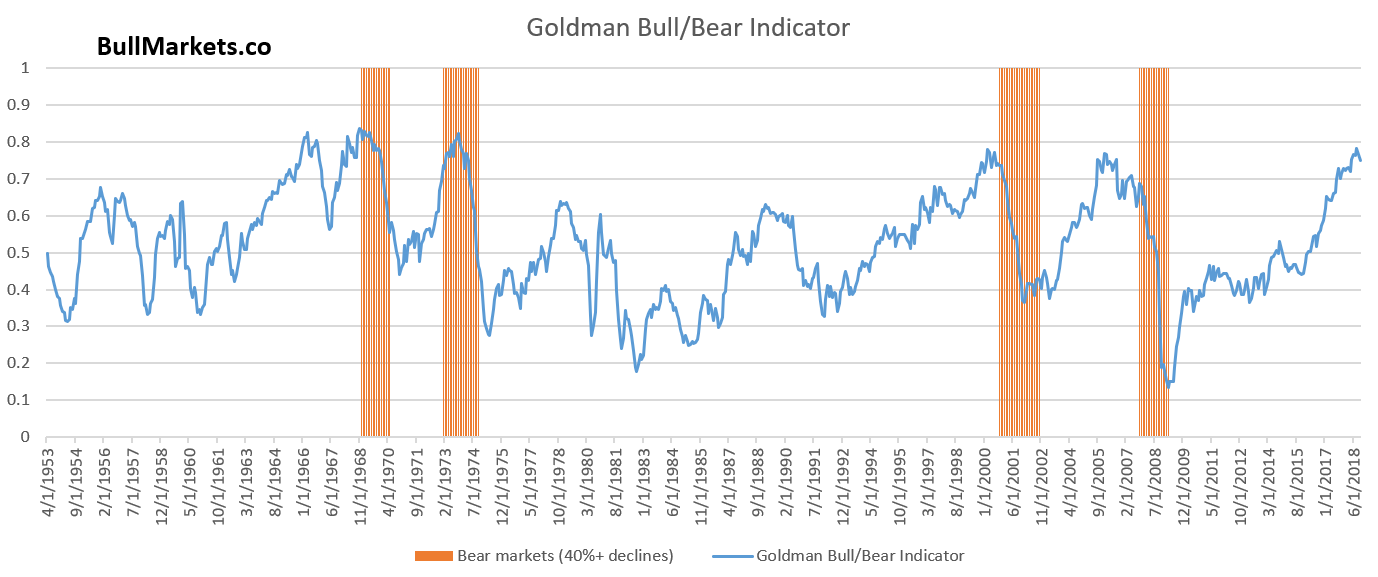
Goldman Sachs’ Bull/Bear Indicator demonstrates that while the bull market’s top isn’t necessarily in, risk:reward does favor long term bears.
Our discretionary outlook is not a reflection of how we’re trading the markets right now. We trade based on our quantitative trading models.
Members can see exactly how we’re trading the U.S. stock market right now based on our trading models.
Click here for more market studies
By Troy Bombardia
I’m Troy Bombardia, the author behind BullMarkets.co. I used to run a hedge fund, but closed it due to a major health scare. I am now enjoying life and simply investing/trading my own account. I focus on long term performance and ignore short term performance.
Copyright 2019 © Troy Bombardia - All Rights Reserved
Disclaimer: The above is a matter of opinion provided for general information purposes only and is not intended as investment advice. Information and analysis above are derived from sources and utilising methods believed to be reliable, but we cannot accept responsibility for any losses you may incur as a result of this analysis. Individuals should consult with their personal financial advisors.
© 2005-2022 http://www.MarketOracle.co.uk - The Market Oracle is a FREE Daily Financial Markets Analysis & Forecasting online publication.