


Ray Dalio: This Debt Cycle Will End Soon
Interest-Rates / US Debt Dec 01, 2018 - 04:16 PM GMTBy: John_Mauldin

 Science tells us energy can neither be created nor destroyed within a closed system. The form may change, but the amount will only stay the same. If this only held true for debt.
Within the closed system called Earth, we create debt much better than we eliminate it.
Well, when we have too much, we eventually get rid of it. But we do so in painful and unpleasant ways—via some kind of debt crisis.
This has happened over and over again throughout history. And there’s real possibility that we will soon face another major debt crisis...
I recently read Ray Dalios’s new book Principles for Navigating Big Debt Crises. It’s fascinating, and I recommend it to everyone. The book helped me refine my understanding of debt crises.
In this article, I’ll explore how Dalio looks at debt cycles and what we can do about them.
Debt Is Cyclical
Like me (and many others throughout history), Ray recognizes that debt can be good or bad. It depends on how it is used.
He goes further with an important insight that debt is cyclical. He explains it so well I will quote him at length here (emphasis mine)
To put these complicated matters into very simple terms, you create a cycle virtually anytime you borrow money. Buying something you can’t afford [out of your capital or cash—JM] means spending more than you make. You’re not just borrowing from your lender; you are borrowing from your future self. Essentially, you are creating a time in the future in which you will need to spend less than you make so you can pay it back. The pattern of borrowing, spending more than you make, and then having to spend less than you make very quickly resembles a cycle. This is as true for a national economy as it is for an individual. Borrowing money sets a mechanical, predictable series of events into motion.
In other words, debt actually creates its own cycles. Lending allows spending that spawns more spending. That eventually reverses into contraction that spawns more contraction. That may seem obvious, but we often forget it.
Debt Cycles Go Through Six Stages
After examining dozens of debt cycles, Ray’s team built this template to describe the six stages of debt cycles.
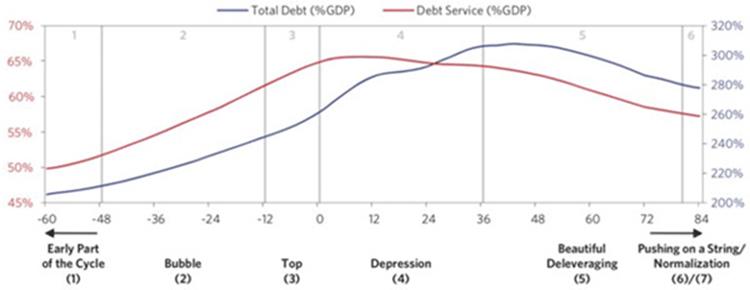
Source: Ray Dalio
Stage 1 is the “good” part. People borrow money, but not too much. They use it for productive purposes. This helps the economy grow and lifts asset prices. And that’s where things start going south.
In Stage 2, which Dalio terms the “Bubble,” people look at the recent past and decide asset prices, total demand, and consumption will keep going up. They overconfidently borrow more money and start having too much leverage.
Stage 3, the “Top,” occurs when central banks, regulators, and sometimes even the lending institutions notice problems. They take measures: raise interest rates, tighten lending standards, and so on.
Stage 4, the “Depression,” happens when growth slows or reverses beyond the ability of monetary and political authorities to help. Yet they keep trying. This is when we see interest rates go to zero or negative. The central bankers are out of bullets at this point. Everyone just has to suffer.
Stage 5 is the deleveraging phase. It is when businesses and families reduce spending to pay down debt and reduce their leverage. It can last a long time. But as leverage falls, people get a handle on their debt service costs and slowly start to recover.
Eventually, the economy reaches Stage 6, normalization, and the cycle repeats.
Where Are We in the Cycle?
Each debt crisis has its unique characteristics, but they generally follow this sequence.
Which raises the question, where are we now? Dalio thinks we are in the late stages and points to interest rates as evidence.
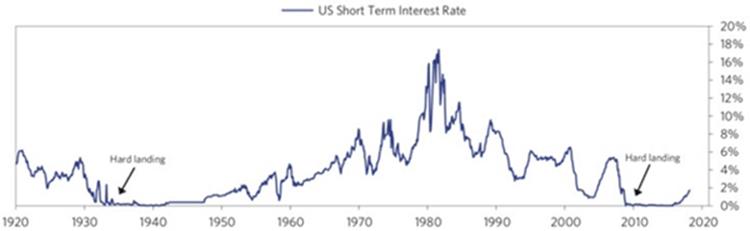
Source: Ray Dalio
Twice in this century, the US went through debt crises so severe that the Fed had to drop rates to zero and resort to unconventional policies like quantitative easing.
The first time was in the 1930s and then again in 2008–2009. In both cases, it “worked” in the sense that asset prices recovered. But it also had adverse side effects.
Unintended Consequences
Higher asset prices benefit asset owners. And most people are not asset owners.
The result is a wealth gap between rich and poor, which of course always exists. But in these periods it grew too obvious to deny.
A small part of society prospers as its assets gain value while the majority struggles. It happened in the Great Depression, and we saw it again in the post-Great Recession years. Data-driven Dalio quantifies it in this chart.
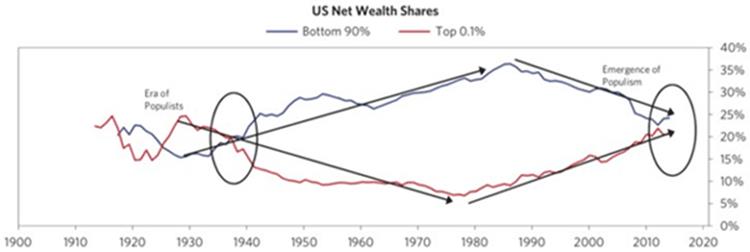
Source: Ray Dalio
Ray originally posted this chart in a 2017 article. I summarized his article in a letter called The Distribution of Pain. His main point then was that it is a serious mistake to think you can understand “the” economy because we really have two economies. The top 40% live in a different world than the bottom 60%.
Combine those conditions of wealth inequality with representative democracy and the result is populism and our currently divided politics.
It may become even more so now that Democrats will control the House next year. The result will be legislative gridlock, which isn’t entirely bad but may stall policy changes that could help postpone recession.
Already-huge federal deficits will therefore keep growing just as the Federal Reserve both raises rates and reduces its balance sheet assets.
In this case, I think the trigger will be a crowding-out effect as Treasury borrowing combined with Fed tightening raises household and corporate debt service costs. Everyone has a breaking point and it is getting closer.
This cycle is in the “seventh-inning stretch.” If you don’t know the term, it is a point near the end of a baseball game.
There’s enough time left for the trailing team to catch up so no one wants to leave yet. You stand up, stretch, singing “Take Me Out to the Ballgame,” then settle back in to see what happens.
That’s kind of where we are today: near the end, but not yet sure of the outcome. The difference is that none of us are just spectators. We are all in the game, and we will all either win or lose.
Join hundreds of thousands of other readers of Thoughts from the Frontline
Sharp macroeconomic analysis, big market calls, and shrewd predictions are all in a week’s work for visionary thinker and acclaimed financial expert John Mauldin. Since 2001, investors have turned to his Thoughts from the Frontline to be informed about what’s really going on in the economy. Join hundreds of thousands of readers, and get it free in your inbox every week.
John Mauldin Archive |
© 2005-2022 http://www.MarketOracle.co.uk - The Market Oracle is a FREE Daily Financial Markets Analysis & Forecasting online publication.