Conditions Ripe For Huge Stock Market Rally
Stock-Markets / Global Stock Markets Sep 19, 2008 - 06:06 AM GMTBy: Chris_Ciovacco
 "The great secret of success in life is for a man to be ready when his opportunity comes." Benjamin Disraeli
In a difficult time for investors, it is refreshing to report a ray of hope in the charts below. In addition to the positive technical developments, two fundamental developments may help the market find an intermediate bottom:
- The Fed injected massive amounts of cash into the banking system in an effort to get banks lending to each other again.
- Senator Charles Schumer proposed a new agency to pump capital into financial companies.
The charts below have been updated as of the market's close on Thursday, September 18, 2008.

Again, from the September 17th article:
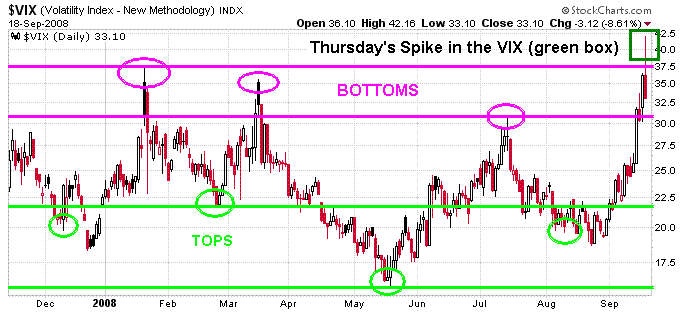
"The VIX peaked in the mid 40s in 2002, so there is room for significantly more downside in stocks. Yesterday's high on the VIX was roughly 34...However, a reading of 34 on the VIX can signal we may be approaching a multi-week rally in stocks."
A VIX Reading of 42 is Rare and Positive For Stocks
Thursday's intraday high on the VIX was 42.16, which shows a rare and high level of fear. Since we are in a bear market, comparisons to high VIX readings in the 2000-2002 bear market are helpful. There were two times in the 2000-2002 bear market where the VIX closed above 42 and stocks reversed course soon thereafter; on September 21, 2001 and July 24, 2002. From September 21, 2000 to January 3, 2002 (after the VIX went over 42), stocks staged a 24.5% bear market rally from the lows. After a reading of 42 on the VIX was made on July 24, 2002, stocks again gained 24.5% before reversing on August 22, 2002. A reading of 42 is rare on the VIX. The fact that we hit 42 yesterday means the odds favor some stock gains in the coming weeks. Please note we are talking odds and probabilities, which mean the outcome could be positive or negative. The odds point toward positive outcomes, which means the grave threat of losses may have lessened at least for a time.From the September 17th article:
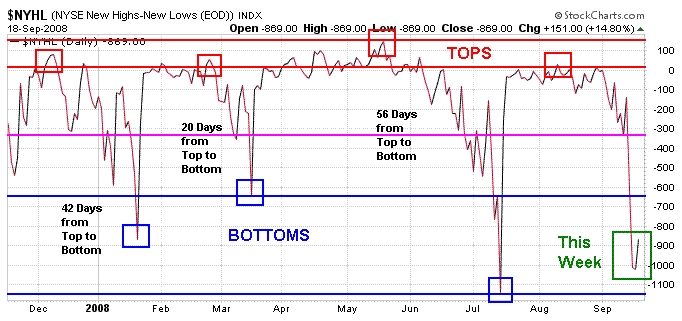
"When a significant number of stocks are making new highs on an exchange, it is bullish. When there are significantly more stocks making new lows then new highs it is indicative of a weak market. When the number of new lows versus new highs gets to more extreme levels, it can signal selling exhaustion or investors "throwing in the towel". The chart below shows the number of new highs minus the number of new lows made on the NYSE. Market tops made in 2008 are shown in the red boxes. Market bottoms made in 2008 are shown in the blue boxes. The reading as of Tuesday's close is shown in the dark green box. During the last bear market, the lowest reading was -907, which occurred on July 24, 2002. After the reading of -907, stocks staged a powerful bear market rally gaining 24% from the July 24, 2002 lows. The 2002 rally lasted four weeks. Tuesday's reading was a -1,014 indicating a strong desire to sell stocks."
The chart below has been updated as of the market's close on Thursday, September 18, 2008.

From the September 17th article - these comments still apply:
"These indicators should not be used in isolation. The VIX could move higher and the NYSE New Highs - New Lows could move lower. However, the indicators and the government's announcement concerning AIG should not be ignored. The best chance for a somewhat permanent bottom in stocks would be for it to occur after another round of strong selling. If new developments support some type of bottom, then defensive positions would become less attractive and growth investments would become more attractive... These indicators do not necessarily point to "the bottom", but they do point toward a possible change in the intermediate trend occurring relatively soon. Any negative news could trigger more declines in a fragile market."
Some Conservative Exposure To Stocks May Be In Order
Since the odds of immediate further declines have decreased, it may be prudent to exit defensive/bear market positions. Since risks remain at elevated levels and the economy still faces serious obstacles on the housing, banking, and employment fronts, any stock rally should be met with a prudent dose of skepticism. The text below from the September 17th article, aligns well with what happened on Thursday, September 18, 2008:
"If the markets rally on Wednesday (or in the coming days), it will be important to see how they act in the last hour of trading. A strong finish Wednesday would be a good sign. A weak finish may indicate the market feels more problems lie ahead, which is most likely the case." On Thursday we did get a rally after stocks came off significant intraday lows. More importantly, volume was strong and the last hour of trading saw a mad rush to buy.
Thursday's reversal and strong finish coupled with the charts above make a reasonable case for the possibility of an intermediate rally in stocks that could last more than a few days (even several weeks). The Fed's massive injection of cash into the banking system and talk of more government intervention may also help fuel what would appear to be an unexpected rally. During bear markets, stocks often rally when people are pessimistic and things look bleak. Some very moderate exposure to stocks with a skeptical and watchful eye may allow us to profit from the possible rally. For most investors, the vast majority of their investment capital should remain insulated from risk.
By Chris Ciovacco
Ciovacco Capital Management
Copyright (C) 2008 Ciovacco Capital Management, LLC All Rights Reserved.
Chris Ciovacco is the Chief Investment Officer for Ciovacco Capital Management, LLC. More on the web at www.ciovaccocapital.com
Ciovacco Capital Management, LLC is an independent money management firm based in Atlanta, Georgia. As a registered investment advisor, CCM helps individual investors, large & small; achieve improved investment results via independent research and globally diversified investment portfolios. Since we are a fee-based firm, our only objective is to help you protect and grow your assets. Our long-term, theme-oriented, buy-and-hold approach allows for portfolio rebalancing from time to time to adjust to new opportunities or changing market conditions. When looking at money managers in Atlanta, take a hard look at CCM.
All material presented herein is believed to be reliable but we cannot attest to its accuracy. Investment recommendations may change and readers are urged to check with their investment counselors and tax advisors before making any investment decisions. Opinions expressed in these reports may change without prior notice. This memorandum is based on information available to the public. No representation is made that it is accurate or complete. This memorandum is not an offer to buy or sell or a solicitation of an offer to buy or sell the securities mentioned. The investments discussed or recommended in this report may be unsuitable for investors depending on their specific investment objectives and financial position. Past performance is not necessarily a guide to future performance. The price or value of the investments to which this report relates, either directly or indirectly, may fall or rise against the interest of investors. All prices and yields contained in this report are subject to change without notice. This information is based on hypothetical assumptions and is intended for illustrative purposes only. THERE ARE NO WARRANTIES, EXPRESSED OR IMPLIED, AS TO ACCURACY, COMPLETENESS, OR RESULTS OBTAINED FROM ANY INFORMATION CONTAINED IN THIS ARTICLE. PAST PERFORMANCE DOES NOT GUARANTEE FUTURE RESULTS.
Chris Ciovacco Archive |
© 2005-2022 http://www.MarketOracle.co.uk - The Market Oracle is a FREE Daily Financial Markets Analysis & Forecasting online publication.


