


The Final Silver Sign
Commodities / Gold and Silver 2018 Sep 26, 2018 - 05:08 PM GMTBy: P_Radomski_CFA

We’ve seen myriads of signs pointing to lower precious metals prices in the past months, weeks, and days. We even discussed how ridiculously similar the current situation is to what happened in 2013, right before the $200+ decline in gold. But the final bearish confirmation usually comes from the silver market and this time is no different.
Let’s take a look at the charts for details (charts courtesy of http://stockcharts.com).
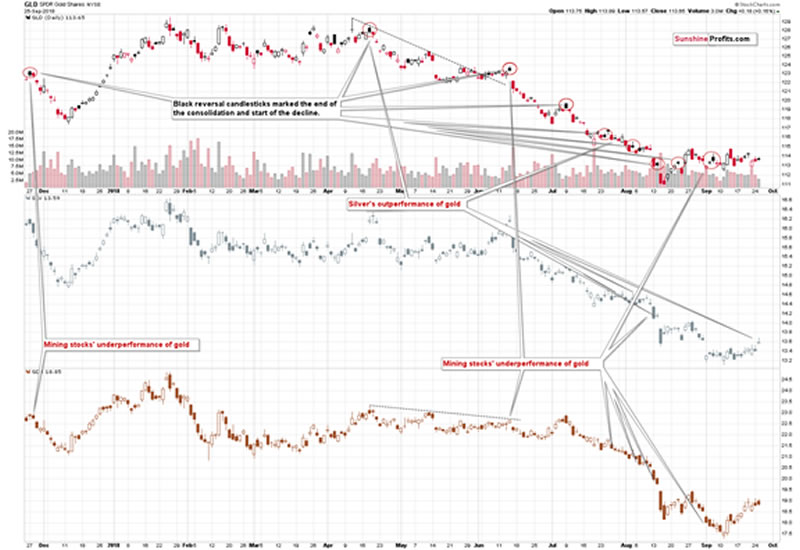
The above chart shows how often silver outperformed gold right before declines and it shows a few additional things as well. One of those things is mining stock’ underperformance and the other is the shape of the sessions of the GLD ETF.
Before moving back to silver, let’s briefly discuss the above two factors. The mining stocks have not underperformed in the last several days, but they definitely have if we take the last couple of months into account. The implications here are bearish, but only on a medium-term basis.
The GLD ETF did form a specific reversal pattern yesterday, but it was not clearly visible as the opening price and closing price are close to each other. This specific pattern is when we see a higher GLD closing prices than the previous closing price, but at the same time, the opening price is even higher. In other words, GLD moves higher considering both closing prices, but it moves lower if we just consider opening and closing prices of a given session. The implications are bearish for the short term, but not strongly so.
The outperformance of silver, however, is clearly visible and its implications are very strongly bearish. Why is this the case? Most importantly, because history proves so. It’s been very often the case when a quick run-up in the white metal that was not confirmed by an analogous rally in gold and mining stocks, was the final moment to exit any long positions and open short ones. We marked some of those cases on the above chart, but the efficiency of this signal extends for many years in the past.
Why is this the case? Because silver is much more attractive to individual investors than it is to big institutions.
One reason is that silver is a much smaller market than gold and this makes it impossible for many big institutions to invest even a small portion of their assets without significantly moving the price. Even if it was possible, they often have rules in place that prevents them from investing if their share in the market was too significant (say over 10% of a given market). But this doesn’t apply to individual investors, which can enter silver at their will. Moreover, individual investors are often more attracted to silver due to the silver manipulation theories.
Now, the thing about individual investors is that they tend to be more emotional than institutions. This makes them want to enter the market particularly strongly, when the emotions are highest. And when are the emotions at their peak? At the tops and right before them. Consequently, seeing silver’s outperformance indicates that the general investment public is aggressively buying (while institutions are not necessarily doing so, or are not doing so as aggressively). This, in turn, suggests that the emotions are reaching zenith and thus a top is being formed.
On a side note, this doesn’t mean that institutions are perfect investors. Far from it; they have their own biases. For instance, since they are usually compared to their peers, they may just be satisfied by holding the same portfolio as everyone else, but with only minor adjustments. This means that they will often miss many investment opportunities. And they can enter into a volatile “panic mode” if some of the peers already get out of the market in a rush – they will not want to be the last one holding the bag. Remember 2008? Exactly.
But, moving back to the point, the above chart is not the only one where we can see silver’s outperformance.
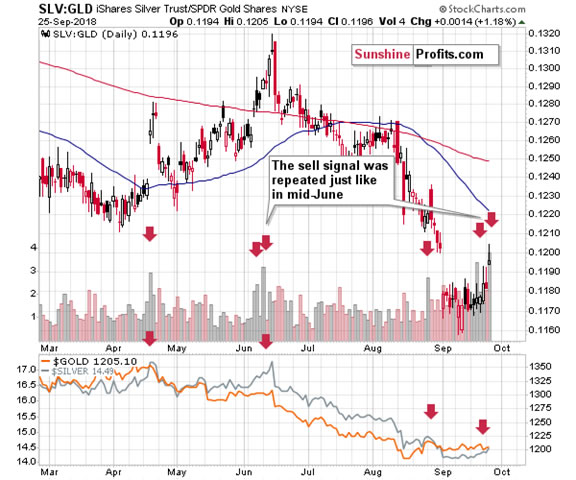
Looking at the SLV to GLD ratio chart provides us with clearly bearish confirmations, not only because of the quick run-up in the value of the ratio, but also because of the volume spikes.
The above chart includes three big rallies in the ratio. The first one took place in mid-April and was followed by big price declines. The second one took place in mid-June and was also followed by big price declines. The third one took place yesterday. And it’s likely to be followed by big price declines as well.
The red arrows mark cases when we saw huge volume spikes in the ratio. More precisely, they show spikes in the ratio of volumes, as the ratio, by itself, doesn’t have any volume.
The spike in the ratio of volumes was the highest in months, which makes it very likely that we are at a major top or very close to one. We saw this signal a few times earlier this year and, in all cases, big price declines in gold and silver followed – if not immediately, then shortly after.
Interestingly, yesterday’s volume spike is a repeat of what we saw a few days earlier, which is exactly what we saw in the first half of June. The implications are bearish.
We now have it all – the initial indication from the ratio of volumes, and the subsequent spike in the price ratio itself. The situation is now just as it was at / just before the April, June, and August declines. The implications are strongly bearish for the short and medium term.
Speaking of bearish short-term analogies, we also have one in the gold stocks.
Gold Stock’s Short-term Analogy
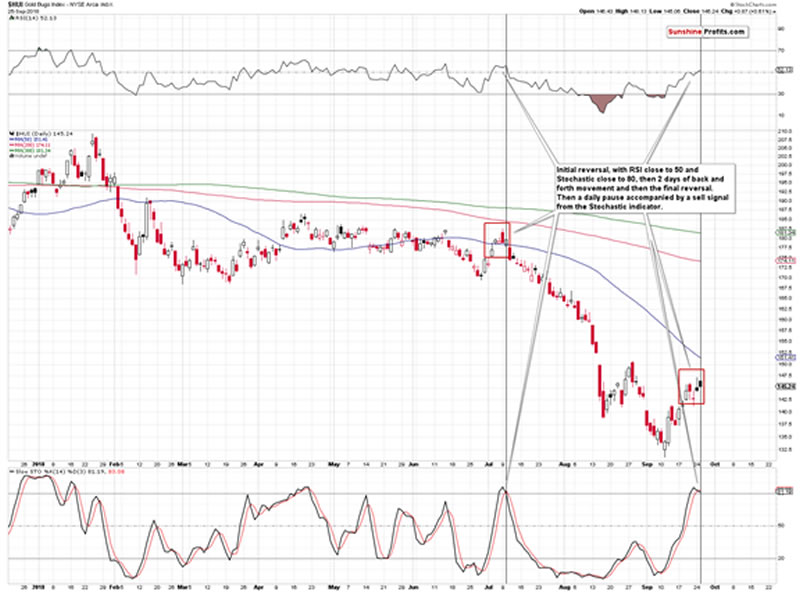
The HUI Index, formed two subsequent bearish shooting star candlesticks, which is a strong bearish indication of short-term nature, but that’s not that we would like to focus on.
The most interesting thing that we see on the above chart, is the similarity to what happened in early July – right before the start of the current big decline.
There was an initial reversal, then 2 days of back and forth trading and then the final reversal. It was all accompanied by the RSI close to 50 and the final top was confirmed by a sell signal from the Stochastic indicator. Then there was a day when the HUI moved back and forth, but ended the session relatively unchanged. And we have the same thing today as well. Back in July, that was the final session before the big decline started, so the implications of this similarity are bearish.
Since we discussed silver and we discussed gold stocks, it’s only natural to take a look at silver stocks as well.
Silver Stocks’ Confirmation
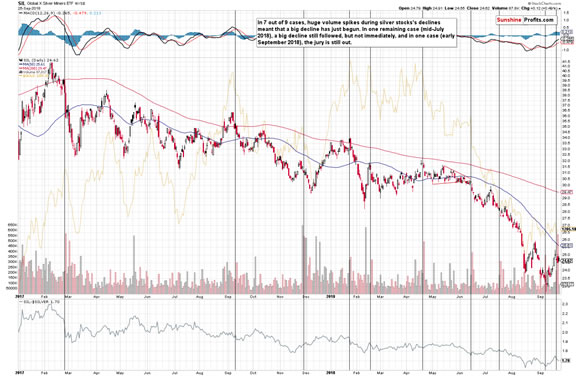
The silver stocks have not only declined this week, but they have done so on huge volume. We marked similar cases with vertical lines. In almost all cases since the beginning of 2017, when we saw declines on huge volume in the SIL ETF, it meant that a big decline is about to begin or that it’s already underway. The signal was reliable not only for silver stocks, but also for the rest of the precious metals sector. You can see how gold performed – its price is in the background of the chart.
Yesterday’s volume was the biggest that we saw in many months, which confirms the strength of the signal. The implications are very bearish.
Summary
Summing up, it seems that the next big downswing in the precious metals sector is already underway. We saw the repeat of mining stocks’ bearish shooting star candlestick and we saw a very short-term outperformance of silver, not to mention the multiple signs that have been pointing to lower PM prices in the following weeks for a long time.
The Fed’s next interest rate decision will be revealed today, so we may see an increase in volatility right before and/or right after it is announced. But, based on multiple signals that we already have, it seems that we are correctly positioned for what’s likely to come.
Please note that the above is based on the data that was available when this essay was published, and we might change our views on the market in the following weeks. If you’d like to stay updated on our thoughts on the precious metals market, please subscribe to our Gold & Silver Trading Alerts.
Thank you.
Przemyslaw Radomski, CFA
Founder, Editor-in-chief
Tools for Effective Gold & Silver Investments - SunshineProfits.com
Tools für Effektives Gold- und Silber-Investment - SunshineProfits.DE
* * * * *
About Sunshine Profits
Sunshine Profits enables anyone to forecast market changes with a level of accuracy that was once only available to closed-door institutions. It provides free trial access to its best investment tools (including lists of best gold stocks and best silver stocks), proprietary gold & silver indicators, buy & sell signals, weekly newsletter, and more. Seeing is believing.
Disclaimer
All essays, research and information found above represent analyses and opinions of Przemyslaw Radomski, CFA and Sunshine Profits' associates only. As such, it may prove wrong and be a subject to change without notice. Opinions and analyses were based on data available to authors of respective essays at the time of writing. Although the information provided above is based on careful research and sources that are believed to be accurate, Przemyslaw Radomski, CFA and his associates do not guarantee the accuracy or thoroughness of the data or information reported. The opinions published above are neither an offer nor a recommendation to purchase or sell any securities. Mr. Radomski is not a Registered Securities Advisor. By reading Przemyslaw Radomski's, CFA reports you fully agree that he will not be held responsible or liable for any decisions you make regarding any information provided in these reports. Investing, trading and speculation in any financial markets may involve high risk of loss. Przemyslaw Radomski, CFA, Sunshine Profits' employees and affiliates as well as members of their families may have a short or long position in any securities, including those mentioned in any of the reports or essays, and may make additional purchases and/or sales of those securities without notice.
Przemyslaw Radomski Archive |
© 2005-2022 http://www.MarketOracle.co.uk - The Market Oracle is a FREE Daily Financial Markets Analysis & Forecasting online publication.