


The FTSE 5 Point Broadening Stock Market Top
Stock-Markets / UK Stock Market Aug 27, 2018 - 09:06 AM GMTBy: Austin_Galt

Pattern – price has moved down off the high and in the process has set up a bearish double top, denoted by the horizontal line. These double tops that form just below the high are generally very bearish as they are with the trend.
Daily Chart
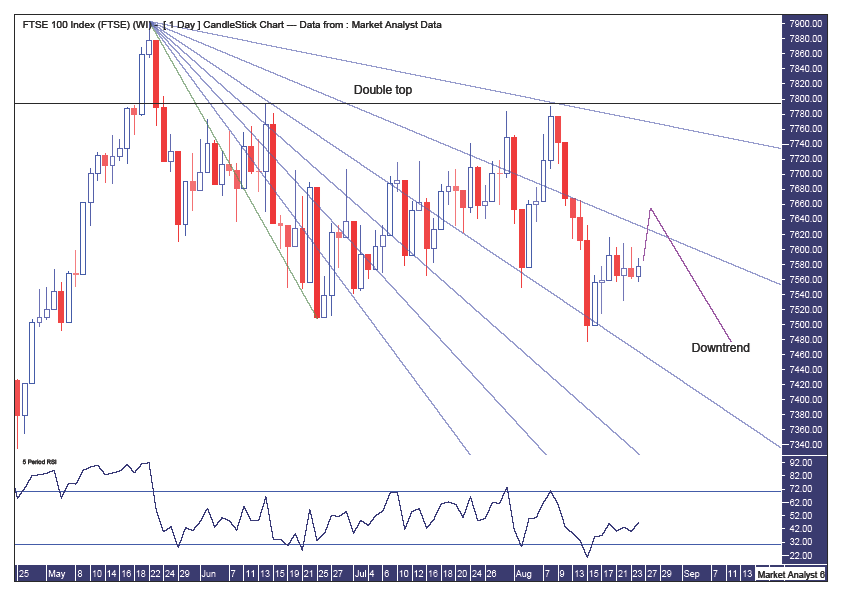
Fibonacci – the recent lower high, which formed the second peak of the double top, was at resistance from the 88.6% angle and price subsequently traded down to the 61.8% angle where support has come in. I now expect price to give resistance from the 76.4% angle a test before turning back down.
RSI – marginally in weak territory but it may nudge back into strong territory. The important thing to take away from this indicator is that the recent low was a new low which suggests there is inherent weakness in price.
Weekly Chart
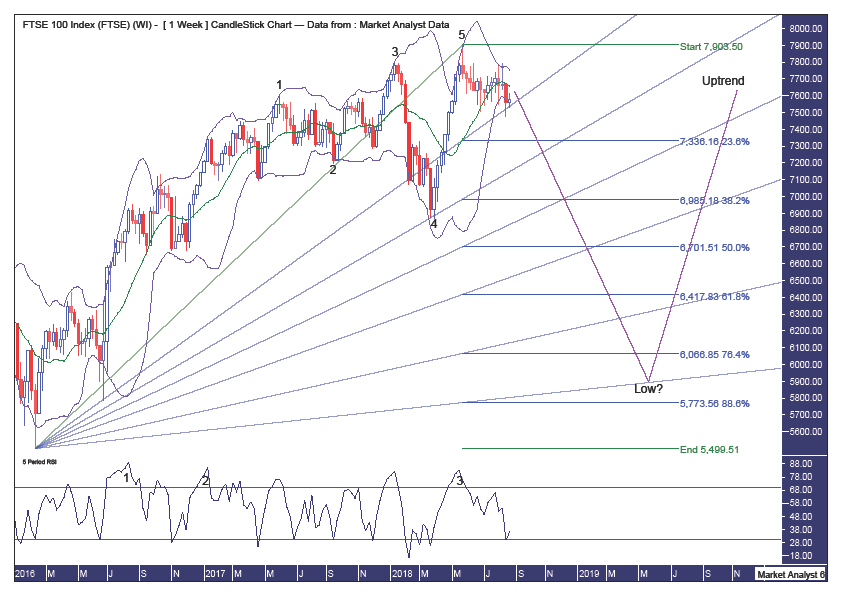
Pattern – a 5 point broadening top is in place and that means price should trade below the point 4 low which stands at 6866. I expect price to trade well below that level.
Bollinger Bands – price is now around support from the lower band and I expect this support to be only very temporary. It would surprise to see price get back to the middle band this coming week. The middle band is around the 7650 level.
Fibonacci – price is currently finding some support at the 23.6% angle which should be hard to overcome. Ultimately, I am targeting this move down to bottom out around support from the 88.6% angle. The 76.4% retracement level of the move up from the February 2016 low stands at 6066 and that is a very valid level for a low to form. The 88.6% retracement level of 5773 is not out of the question either. Perhaps somewhere in between.
RSI – a triple bearish divergence is in place.
Quarterly Chart
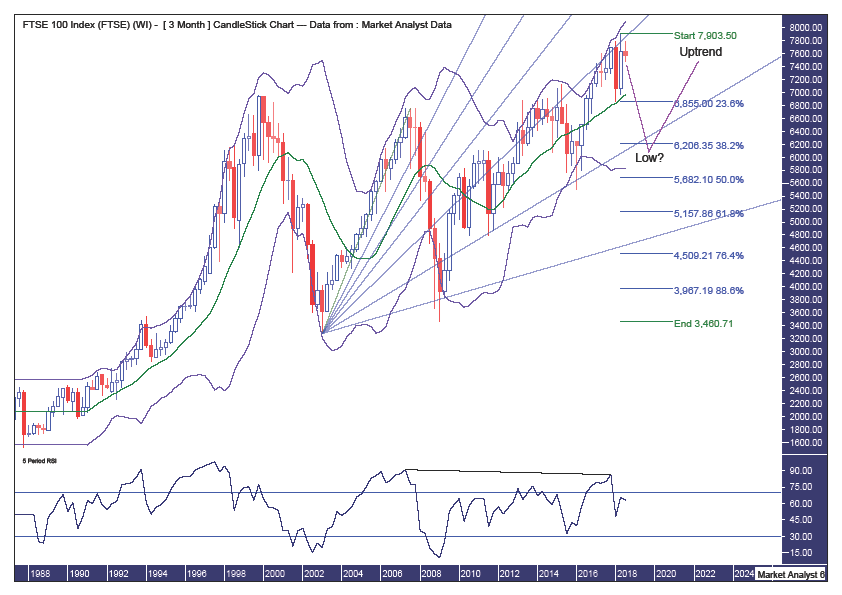
Pattern – a massive bull market is in play and this expected move down should do no damage to it, although it may start to feel like it as price plummets into “bear market” territory which is generally characterised by a 20% price drop.
Bollinger Bands – price previously found support at the middle band but hasn’t been able to go on with the job and get back to the upper band and beyond. It still could. Not for mine though.
Fibonacci – the 61.8% angle has been providing solid resistance and perhaps price now needs a rest before tackling this resistance at a later date. For now, I favour a move back to support from the 76.4% angle. And I expect price to give this support angle a test. The 38.2% retracement level at 6206 looms as a good target for price to get down to and, once again, I favour price to give this support level a test.
RSI – a bearish divergence is in place.
Summing up – I believe a substantial move down is in its infancy with price to get smashed in the vicinity of 20% from current levels over the next 12 months.
By Austin Galt
Austin Galt has previously worked as a stockbroker and investment banker while studying technical analysis for over two decades. He is also the author of the book White Night: A Colombian Odyssey
Email - info@thevoodooanalyst.com
© 2018 Copyright The Voodoo Analyst - All Rights Reserved
Disclaimer: The above is a matter of opinion provided for general information purposes only and is not intended as investment advice. Information and analysis above are derived from sources and utilising methods believed to be reliable, but we cannot accept responsibility for any losses you may incur as a result of this analysis. Individuals should consult with their personal financial advisors.
Austin Galt Archive |
© 2005-2022 http://www.MarketOracle.co.uk - The Market Oracle is a FREE Daily Financial Markets Analysis & Forecasting online publication.