


Live Cattle Commodity Trading Analysis
Commodities / Livestock Jul 12, 2018 - 12:35 PM GMTBy: Austin_Galt

 Pattern – a downtrend is clearly in process while the action since 2017 looks corrective in nature. I believe this corrective phase still has a little more time left before the downtrend resumes.
Bollinger Bands – price has been finding resistance from the middle band but I favour price to overcome it shortly and head up to the upper band where the next lower high can form.
Weekly Chart
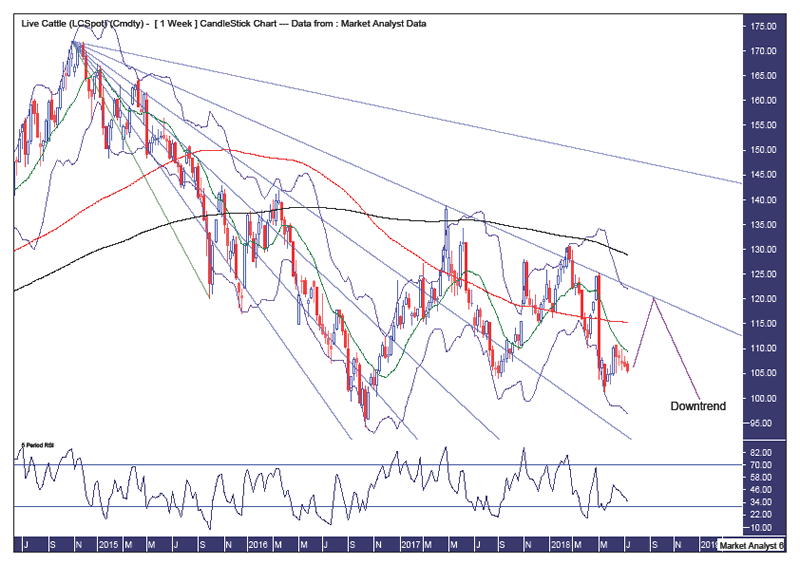
Fibonacci – price is trading down between the 61.8% and 76.4% angles which are providing support and resistance respectively. Should price rally now then the 76.4% angle is a good spot to look for the next expected lower high.
Moving averages – in a bearish position.
RSI – weak and while I suspect a small rally may unfold shortly, it is certainly no sure bet and bulls should be cautious.
Quarterly Chart
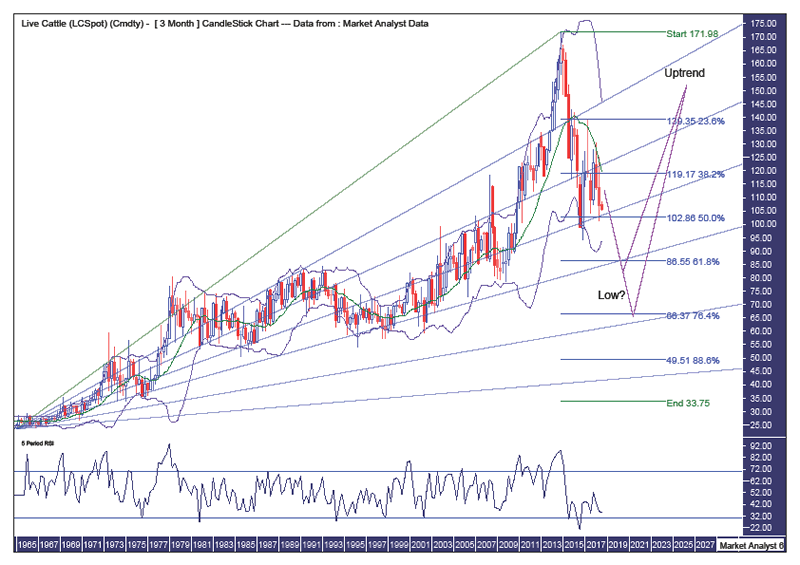
Pattern – we can see a solid uptrend took place over 50 years before price rocketed up into a high in 2014. Price has declined steeply from that high and I expect this decline still has plenty of time and price to go. This decline, however, may not occur as quickly as the lines I have drawn suggest. Or perhaps it will. The market will decide that.
Bollinger Bands – price has found solid resistance from the middle band and, while another crack at that band is certainly on the cards, I believe price will get back down to the lower band before the next bull market commences.
Fibonacci – price is at the 50% angle which may provide some support. If so, the rally back to the 38.2% angle should be the play and it is there that the next lower high may form. Ultimately, I am targeting the 61.8% or 76.4% angle to see in the final low. Personally I favour the latter and that would see price get down to around the 76.4% retracement level of $66.37. Certainly, I expect price to get down to, and at a minimum clip, the 61.8% retracement level of $86.55.
RSI – weak.
Summing up – I believe the downtrend is set to continue in the foreseeable future with any rallies over the short term to be bear market rallies only.
By Austin Galt
Austin Galt has previously worked as a stockbroker and investment banker while studying technical analysis for over two decades. He is also the author of the book White Night: A Colombian Odyssey
Email - info@thevoodooanalyst.com
© 2018 Copyright The Voodoo Analyst - All Rights Reserved
Disclaimer: The above is a matter of opinion provided for general information purposes only and is not intended as investment advice. Information and analysis above are derived from sources and utilising methods believed to be reliable, but we cannot accept responsibility for any losses you may incur as a result of this analysis. Individuals should consult with their personal financial advisors.
Austin Galt Archive |
© 2005-2022 http://www.MarketOracle.co.uk - The Market Oracle is a FREE Daily Financial Markets Analysis & Forecasting online publication.