General Motors (GM) Breaks Out
Stock-Markets / US Stock Markets Sep 12, 2008 - 03:03 AM GMTBy: Mike_Paulenoff
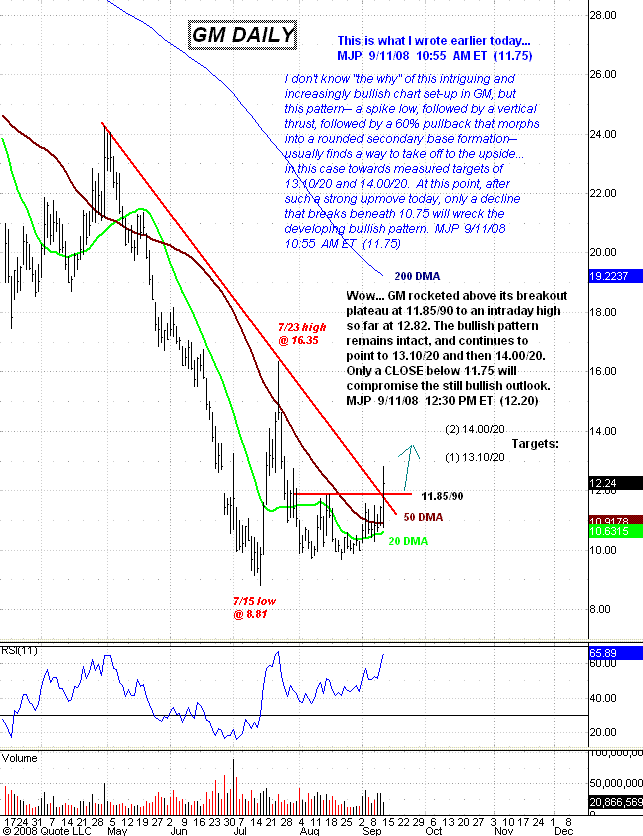
 We told our subscribers earlier today with General Motors (NYSE: GM )at 11.75 that the pattern -- a spike low followed by a vertical thrust, followed by a 60% pullback that morphs into a rounded secondary base formation -- usually finds a way to take off to the upside. Wow, did GM rocket after that, above its breakout plateau at 11.85/90 to an intraday high so far at 12.82. The bullish pattern remains intact and continues to point to 13.10/20 and then 14.00/20. Only a close below 11.75 will compromise the still bullish outlook.

Sign up for a free 15-day trial to Mike's ETF Trading Diary today.
By Mike Paulenoff
Mike Paulenoff is author of the MPTrader.com (www.mptrader.com) , a real-time diary of Mike Paulenoff's trading ideas and technical chart analysis of Exchange Traded Funds (ETFs) that track equity indices, metals, energy commodities, currencies, Treasuries, and other markets. It is for traders with a 3-30 day time horizon, who use the service for guidance on both specific trades as well as general market direction
© 2002-2008 MPTrader.com, an AdviceTrade publication. All rights reserved. Any publication, distribution, retransmission or reproduction of information or data contained on this Web site without written consent from MPTrader is prohibited. See our disclaimer.
Mike Paulenoff Archive |
© 2005-2022 http://www.MarketOracle.co.uk - The Market Oracle is a FREE Daily Financial Markets Analysis & Forecasting online publication.


