A Gold Sector Fundamental View
Commodities / Gold and Silver 2018 May 01, 2018 - 10:14 AM GMTBy: Gary_Tanashian
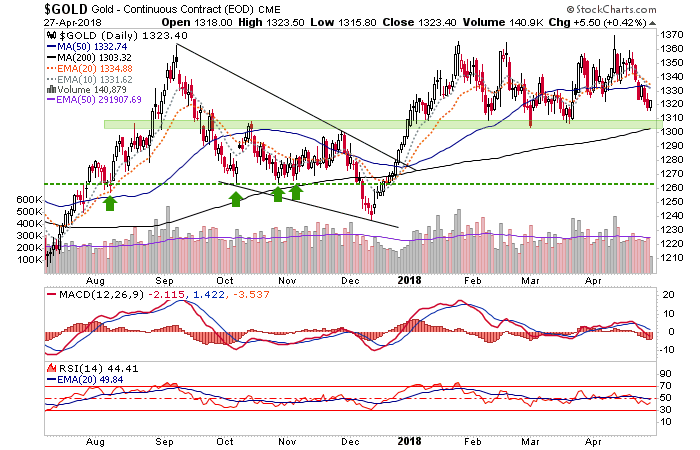
 With gold testing its 200 day moving average this morning I thought I’d reproduce the first part of the precious metals segment from week’s Notes From the Rabbit Hole (NFTRH 497), including a daily chart of gold at the end showing the anticipated SMA 200 test.
[edit] Steve Saville updates gold’s ‘true fundamentals’ here. Notice at the end what is not considered fundamentally material.
Precious Metals
We have done a lot of work delineating what the best investment environment would be for gold and especially the gold mining sector. The gold miners leverage (for better or worse) gold’s performance vs. cyclical items like stocks, commodities and materials. Gold vs. stocks is a macro fundamental indicator on investor confidence, or lack thereof. Gold vs. Energy and Materials are gold sector fundamentals directly informing a gold mining company’s bottom line performance (their product vs. mining cost inputs).
When inflation is taking root and the economic cycle is up, the gold sector is suspect for the reasons stated above. It is and has been suspect to this point by definition, because gold is either in long-term down trends (vs. stocks) or has been flat lining for 2 years (vs. commodities). Let’s realize that gold and the gold sector can and probably would go up in an inflationary boom (assuming gold were out performing stocks) but the fundamentals would degrade as long as the economy remained firm.
So I am talking about fundamentals vs. prices and perception. In 2005-2008 gold bugs pumped and pumped with silliness about why you should buy gold stocks because oil was going up and China and India were growing and resources of all kinds were going to the moon. A just resolution to this promotion came about in late 2008.
So I stand by these declarations and realize I am ignored (at best) by a not small segment of the gold cult “community”. It would be easy to put out a public article every week like some do, always focused on gold or gold stocks, calling the play-by-play for enthralled bugs; micro-manage the sector as if it were the only one that matters.
But that is the point, I’ll happily focus more pointedly on the sector when its signals come in a way that I can feel good about myself while doing so. If you cannot have your gut in line with your analysis, you are a promoter and you just don’t give a shit.
So if gold stocks go up with an inflation trade and the funda do not look appealing, we will chart the technical view to manage the upside but we will also note every step of the way what is unhealthy about the rally. Much like the pre-NFTRH Gary used to do, as needed, from 2005 to 2008.
If you were a market player back in Q4 of 2008 try to think back to what the word from the gold micro managers was back then. In full panic mode after their inflationary rally fell apart: It’s a deflationary crash! The inflation failed and gold is going to 400, 600 (or whatever horrific downside they were imagining)! The deflation was followed by balls out inflation by will of man as the USD skyrocketed (gaining the liquidity bid), gold followed and so too – for fundamentally sounds reasons – did the miners.
What actually happened in Q4 2008 was gold rocketed vs. crude oil, materials and stock markets before beginning to climb in USD and other currencies. That was a mainline of fundamental juice to the miners’ bottom lines, right in the midst of a massive crash and buying opportunity.
The reason it was such a massive opportunity that so few took advantage of in real time is they were either gripped in fear, listening to gold experts (i.e. touts) who were busy doing damage control, or they were simply out of dry powder after getting put all-in by said touts in the 2003-2008 period during which the inflationary bull market lifted stocks, commodities, economies and the gold sector.
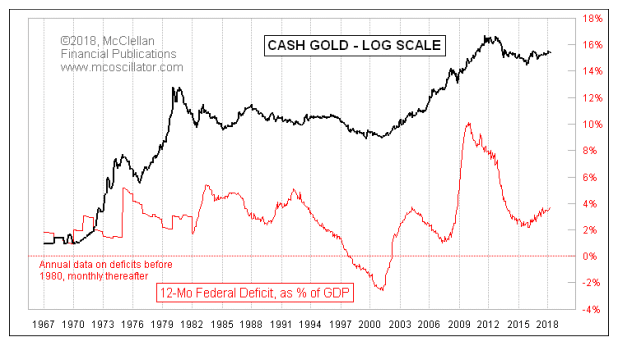
Let’s move on to an interesting correlation on gold as presented by Tom McClellan by way of Biiwii.com: Deficits and Gold.
When the government runs a deficit, which is almost always, it is safe to say that it is spending beyond its means, often in support of fiscal stimulus of the economy. Logically, if the thing needs constant stimulus it can not be fundamentally sound, from an organic perspective. The long-term price of gold seems to know this. You might want to read the entire post (it’s not long) but here is Tom’s conclusion…
“But now Congress has given up on that silly old-fashioned notion of having a balanced budget, and gold prices are starting to rise again. The revised tax tables for 2018 have not really started to have a big effect yet on the 12-month trailing total of federal tax receipts, but in the months ahead we can expect that factor to start bending the receipts line lower, and thus the deficit line higher.
If the demonstrated correlation of the past 40+ years continues in the future, then the presumptive higher deficit rates should be bullish for gold prices. And that should continue right up until the point when Congress realizes that running a ginormous debt might not be a good thing, at which point we should see another major top in gold prices. Congress does not seem to be anywhere near the point of making that realization, and so the message for the gold bulls is that it is game-on, and gold should be making a big general uptrend.”

Dialing back to our regular work, gold is knocking on the door of major resistance and it has been doing so for months. Nothing has happened recently to compromise that posture, as we have allowed for a test of the 200 day average and support.

The segment then went on to cover silver, HUI’s bounce and sector indicators before reviewing several gold and silver miner charts.
Subscribe to NFTRH Premium for your 40-55 page weekly report, interim updates and NFTRH+ chart and trade ideas or the free eLetter for an introduction to our work. Or simply keep up to date with plenty of public content at NFTRH.com and Biiwii.com. Also, you can follow via Twitter ;@BiiwiiNFTRH, StockTwits, RSS or sign up to receive posts directly by email (right sidebar).
By Gary Tanashian
© 2018 Copyright Gary Tanashian - All Rights Reserved
Disclaimer: The above is a matter of opinion provided for general information purposes only and is not intended as investment advice. Information and analysis above are derived from sources and utilising methods believed to be reliable, but we cannot accept responsibility for any losses you may incur as a result of this analysis. Individuals should consult with their personal financial advisors.
Gary Tanashian Archive |
© 2005-2022 http://www.MarketOracle.co.uk - The Market Oracle is a FREE Daily Financial Markets Analysis & Forecasting online publication.


