


The Beautiful Chartology of SLV Silver ETF
Commodities / Gold and Silver 2018 Apr 09, 2018 - 08:16 PM GMT

 SLV along with the PM stocks have been under performing gold in a pretty significant way. Normally you would like to see the PM stocks outperforming gold on the front end of a bull market similar to what we saw back in the beginning of the 2000 bull market in the PM complex. So far that hasn’t been the case.
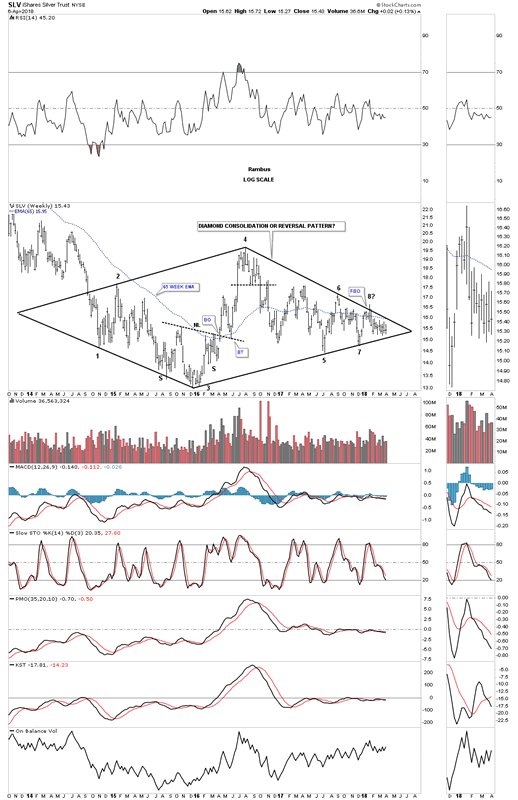
Below is a weekly chart for SLV we’ve been following for a long time now as it has been chopping out the nearly four year diamond trading range. The first thing that would get my attention would be if the price action could takeout the top rail of the seven point diamond which is technically a reversal pattern at the moment. A touch of the bottom rail would complete the 8th reversal point which would be a consolidation pattern to the downside if the bottom rail is broken. It wouldn’t hurt to see SLV trade back above the 65 week ema if one is a bull.
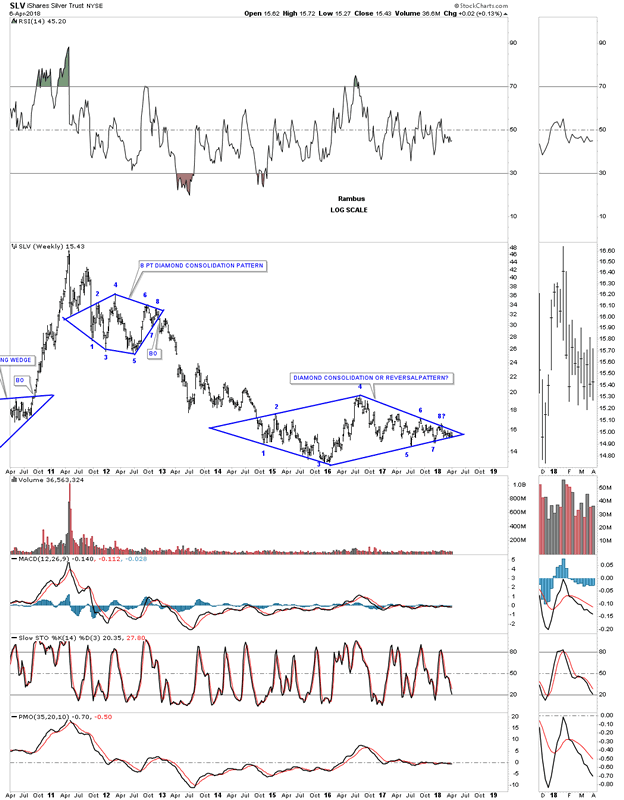
This next chart for SLV is a longer term weekly look which puts the diamond in perspective. If you’re a long term member you may remember the 8 point diamond that formed back in 2012 which led to a big impulse move down.
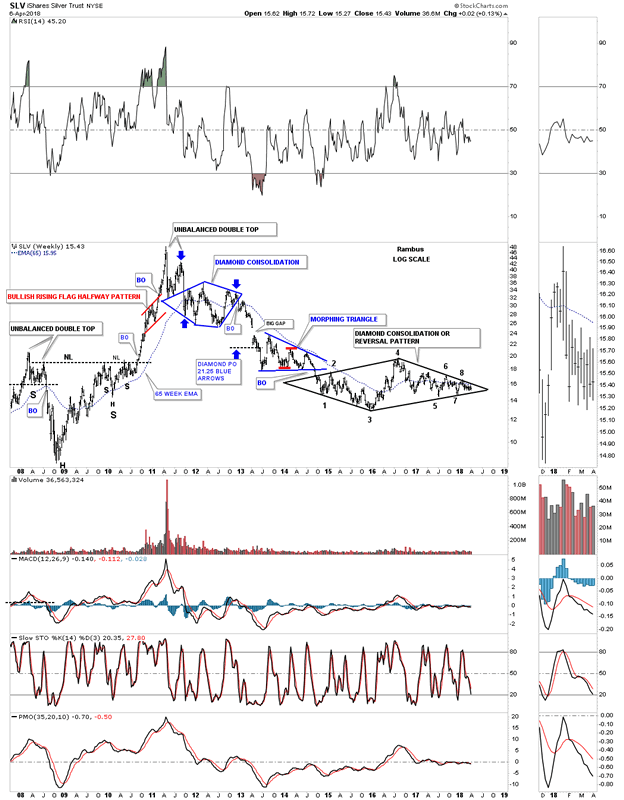
This next weekly chart has a lot of Chartology on it which shows SLV produces some really nice chart patterns. The 2008 crash low produced the head of a large H&S consolidation pattern which led directly to the the high at 50. Note how the right shoulder was a small H&S pattern. SLV also built out a beautiful red bullish rising flag as a halfway pattern to the 50 area in time and price. So far there is nothing on this chart that strongly suggests to me the bear market is over and a new bull market has started.
Since the April 2011 high which took place a full five months before gold and the PM stock indexes topped in September, we can see one consolidation pattern forming below the previous one. The current diamond has a chance to be a reversal pattern, but the bulls need to take control so until then the downtrend continues. SLV has gone virtually nowhere in nearly four years which has been dead money if any one is a long term holder.
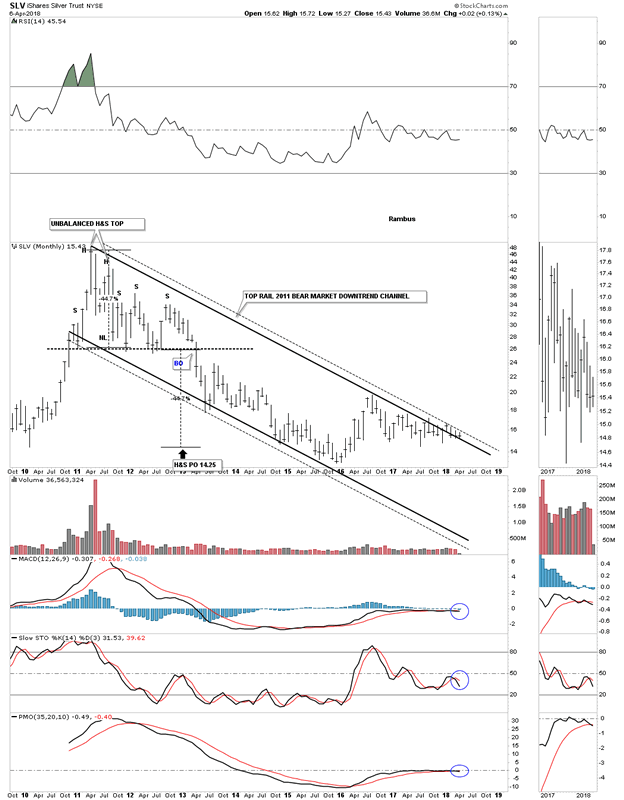
This last chart for SLV is a long term monthly chart which shows its parallel double trendline downtrend channel. It wouldn’t take a lot of work to turn SLV bullish, but the bulls need to step up to the plate with action and walk the walk. I would love for nothing more than to see the diamond resolved to the upside. Have a great weekend and all the best…Rambus
Editor’s Note: Here is the original Silver Diamond Post from 2012…Seems Silver and Diamonds are a thing
https://rambus1.com/2012/12/23/weekend-report-a-look-at-silver-and-its-diamond/
All the best
Gary (for Rambus Chartology)
FREE TRIAL - http://rambus1.com/?page_id=10
© 2018 Copyright Rambus- All Rights Reserved
Disclaimer: The above is a matter of opinion provided for general information purposes only and is not intended as investment advice. Information and analysis above are derived from sources and utilising methods believed to be reliable, but we cannot accept responsibility for any losses you may incur as a result of this analysis. Individuals should consult with their personal financial advisors.
© 2005-2022 http://www.MarketOracle.co.uk - The Market Oracle is a FREE Daily Financial Markets Analysis & Forecasting online publication.