21 Trillion Reasons to Own Gold
Commodities / Gold and Silver 2018 Apr 07, 2018 - 04:26 PM GMTBy: Arkadiusz_Sieron
 Do you know how much a trillion is (we refer here to the short scale)? A billion is hard enough to imagine, much less a trillion. But let’s try. We can write it as 1,000,000,000,000 – that’s a 1 with twelve zeroes. In other words it’s million million, or ten to the twelfth (1012). One trillion of dollars in $100 dollar bills would stack up to about 631 miles high. Given that the average annual income in the U.S. is around $50,000, Joe Schmo would have to save 20 million of years (and not consuming at all) to stockpile a trillion dollars. Sounds enormous, right? So now multiply it by 21 and you will obtain the new level of the U.S. federal debt (here you can watch a movie visualizing the U.S. debt of $20 trillion).
It escalated really quickly. In September 2017, we reported that the total value of U.S. national surpassed $20 trillion. In March, after just half a year, the U.S. federal government added another trillion of debt. And what is even more important, the U.S. indebtedness is not likely to decrease anytime soon. Actually, the Congress has just agreed to cut taxes and spend even more. It will add even more obligations on top of an already existing pile of debts.
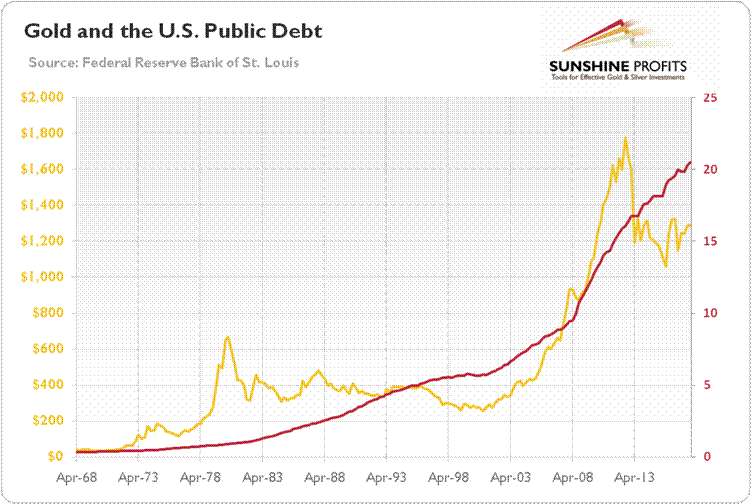
Let’s look at the chart below. As one can see, the recent trajectory is rather unsustainable. The federal deficit increased from $587 billion in the last year of Obama’s presidency to about $665 billion in Trump’s first year of presidency.
Chart 1: The total U.S. national debt (red line, right axis, in $ trillions) and the gold prices (yellow line, left axis, London P.M. Fix, in $) from 1968 to 2017.

And according to the Treasury Borrowing Advisory Committee, the U.S. federal government will have to borrow about trillion in fiscal year 2018. It implies that at the current pace, the government is on track to add at least $10 trillion in the next decade, largely due to the soaring military expenditures.
What does it all mean for the gold market? Well, the worsening of the U.S. fiscal position could support the precious metals, as was the case during the 2000s. The fears about the twin deficits, combined with the commodity bull market, boosted the price of gold then.
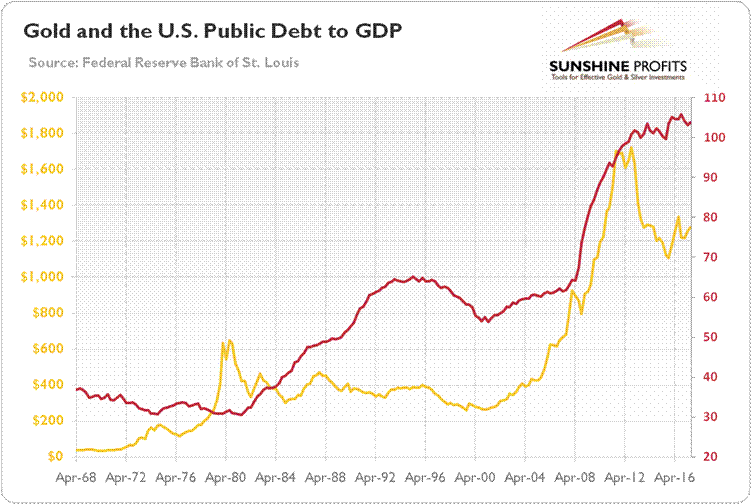
However, the U.S. real GDP growth has also accelerated recently. Hence, the ratio of the country’s public debt to GDP has generally remained at the similar level since 2013, as the chart below shows.
Chart 2: The total U.S. national debt (red line, right axis, as % of GDP) and the gold prices (yellow line, left axis, London P.M. Fix, in $) from 1968 to 2017.

Hence, although serious, the U.S. fiscal position is not yet hopeless. What really matters is flows, not stocks. Surely, Trump cut taxes and increased spending, but the accelerated economic growth should support the revenue side of the equation. We don’t praise the current U.S. fiscal policy – what we’re saying is that the federal debt is not likely to explode during an economic boom. Just look at the chart above once more. The relative indebtedness had been increasing steadily in the 2000s, but it surged only after the Great Recession occurred.
To sum up, U.S. public debt has surpassed $21 trillion. Investors should remember that there is nothing special in that particular threshold. Default is still unlikely. The truth is that flows are more important than the stock – of course, the fiscal deficits are also rising, but as long as the expansion lasts, nothing wrong should happen. Having said that, a lack of any reforms during good times will take revenge in bad times. As a safe-haven asset, gold should benefit then. Actually, the U.S. public debt has jumped over $1 trillion in Trump’s first year, even though the real spending is still ahead of us. When the next crisis hits, the debt-to-GDP ratio will balloon. Given that it is already above 100 percent, and the interest rates are rising, the U.S. creditors could then lose their patience. When this happens, gold should shine – contrary to debt instruments, it bears no counterparty risk.
If you enjoyed the above analysis and would you like to know more about the gold ETFs and their impact on gold price, we invite you to read the April Market Overview report. If you're interested in the detailed price analysis and price projections with targets, we invite you to sign up for our Gold & Silver Trading Alerts . If you're not ready to subscribe at this time, we invite you to sign up for our gold newsletter and stay up-to-date with our latest free articles. It's free and you can unsubscribe anytime.
Arkadiusz Sieron
Sunshine Profits‘ Market Overview Editor
Disclaimer
All essays, research and information found above represent analyses and opinions of Przemyslaw Radomski, CFA and Sunshine Profits' associates only. As such, it may prove wrong and be a subject to change without notice. Opinions and analyses were based on data available to authors of respective essays at the time of writing. Although the information provided above is based on careful research and sources that are believed to be accurate, Przemyslaw Radomski, CFA and his associates do not guarantee the accuracy or thoroughness of the data or information reported. The opinions published above are neither an offer nor a recommendation to purchase or sell any securities. Mr. Radomski is not a Registered Securities Advisor. By reading Przemyslaw Radomski's, CFA reports you fully agree that he will not be held responsible or liable for any decisions you make regarding any information provided in these reports. Investing, trading and speculation in any financial markets may involve high risk of loss. Przemyslaw Radomski, CFA, Sunshine Profits' employees and affiliates as well as members of their families may have a short or long position in any securities, including those mentioned in any of the reports or essays, and may make additional purchases and/or sales of those securities without notice.
Arkadiusz Sieron Archive |
© 2005-2022 http://www.MarketOracle.co.uk - The Market Oracle is a FREE Daily Financial Markets Analysis & Forecasting online publication.


