


Gold Price Set For Sparkling Rally
Commodities / Gold and Silver 2018 Apr 05, 2018 - 02:05 PM GMTBy: Austin_Galt

 Latest Price – $1340.20
Pattern – price looks to have been consolidating these past few months and as price rose into this consolidation pattern it should leave the same way – up. Breaking below the low of this consolidation phase at $1303 could be one area to place stops.
Bollinger Bands – price found support three separate times at the lower band. I doubt there will be a fourth time and price looks to have recently found support at the middle band.
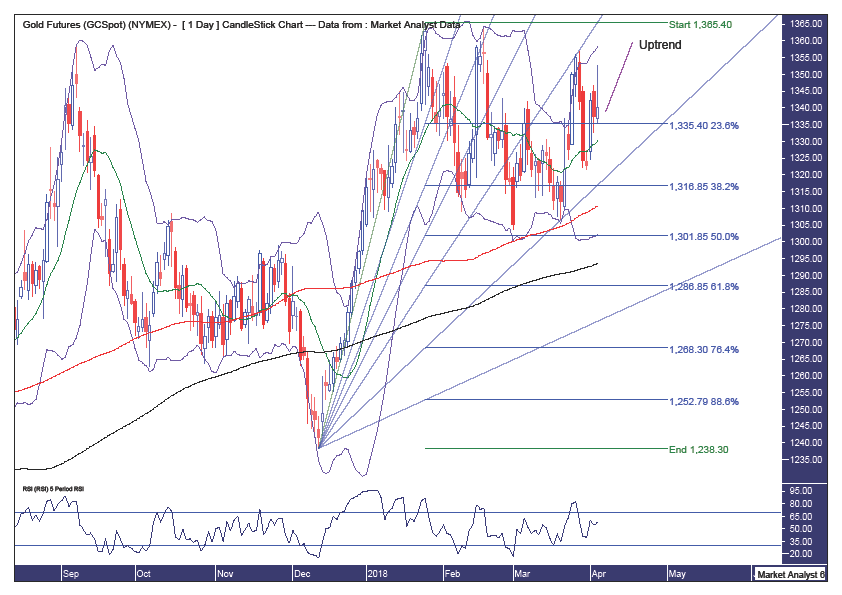
Fibonacci – price retraced to just above the 50% level leaving the uptrend in a solid position. The 61.8% angle has been providing resistance while the 76.4% angle has provided support and I would not like to see a solid move below this 76.4% angle. I doubt that and instead believe price can trade up along the 61.8% angle to new rally highs. Let’s see.
Moving averages – in a bullish position with the 100 day moving average (red) above the 200 day moving average (black).
RSI – in strong territory and generally trending up – a good sign.
Monthly Chart
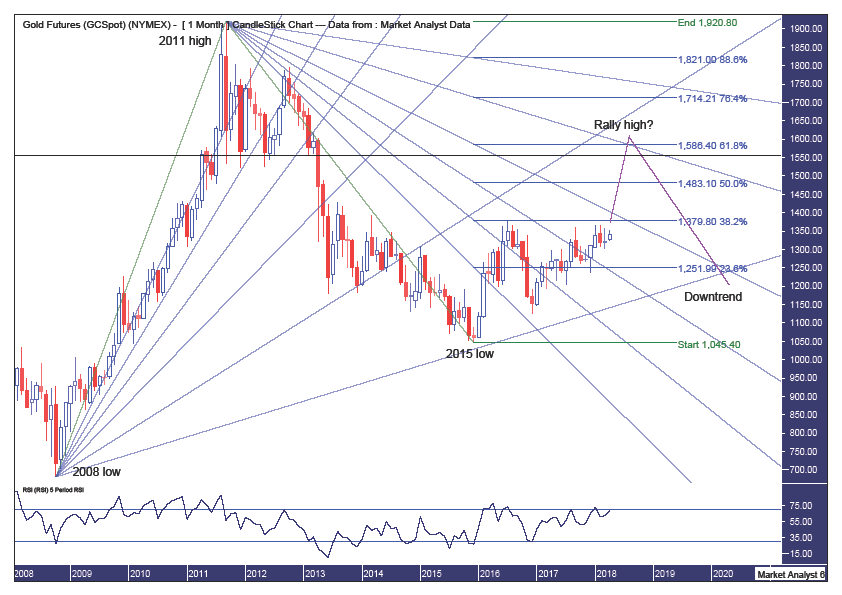
Pattern – price is knocking on the door of overhead resistance set in July 2016 at $1377 and I believe a break above that level is imminent. I also believe this is a bear rally only and a sharp rally from here will get punters thinking the bull market is back on. I believe that would be a wrong assumption.
Fibonacci – resistance has been the 38.2% retracement level while I am looking for the bear rally to ultimately terminate around the 61.8% level at $1586. The bullish fan shows the 88.6% angle providing support for the 2015 low and the 76.4% angle is now resistance although I doubt price can reach it. It may go close though. I am looking for price to rally up to the 76.4% angle on the bearish fan before the overall downtrend resumes.
Horizontal line – denotes the February 2013 low of $1554 and that is where the gold crash of 2013 picked up steam after breaking below that level. Price often returns to where a crash started and that is where I believe price is headed and perhaps nudging a touch above.
RSI – in a very strong position and a cracking move higher now would not surprise at all.
Summing up – bullish over coming months, expecting a solid move higher to complete the bear rally that has been in force since the 2015 low.
By Austin Galt
Austin Galt has previously worked as a stockbroker and investment banker while studying technical analysis for over two decades. He is also the author of the book White Night: A Colombian Odyssey
Email - info@thevoodooanalyst.com
© 2018 Copyright The Voodoo Analyst - All Rights Reserved
Disclaimer: The above is a matter of opinion provided for general information purposes only and is not intended as investment advice. Information and analysis above are derived from sources and utilising methods believed to be reliable, but we cannot accept responsibility for any losses you may incur as a result of this analysis. Individuals should consult with their personal financial advisors.
Austin Galt Archive |
© 2005-2022 http://www.MarketOracle.co.uk - The Market Oracle is a FREE Daily Financial Markets Analysis & Forecasting online publication.